datadog
The datadog plugin supports the integration with Datadog, one of the most used observability service for cloud applications. When enabled, the plugin pushes metrics to DogStatsD server, which comes bundled with the Datadog agent, over UDP protocol.
Metrics
The plugin exports the following metrics by default.
All metrics will be prefixed by the namespace configured in metadata. For example, if the namespace is configured to be apisix, you will see the request.counter metric exported as apisix.request.counter in Datadog.
| Name | Type | Description |
|---|---|---|
| request.counter | counter | Number of requests received. |
| request.latency | histogram | Time taken to process the request, in milliseconds. |
| upstream.latency | histogram | Time taken to proxy the request to the upstream server until a response is received, in milliseconds. |
| apisix.latency | histogram | Time taken by APISIX agent to process the request, in milliseconds. |
| ingress.size | timer | Request body size in bytes. |
| egress.size | timer | Response body size in bytes. |
Tags
The plugin exports metrics with the following tags.
When there are no suitable values for any particular tag, the tag will be omitted.
| Name | Description |
|---|---|
| route_name | Name of the route. If not present or if the attribute prefer_name is set to false, fall back to the route ID. |
| service_name | Name of the service. If not present or if the attribute prefer_name is set to false, fall back to the service ID. |
| consumer | Username of the consumer if the route is connected to a consumer. |
| balancer_ip | IP address of the upstream balancer that processes the current request. |
| response_status | HTTP response status code, such as 201, 404, or 503. |
| response_status_class | HTTP response status code class, such as 2xx, 4xx, or 5xx. Available in APISIX from version 3.14.0 and API7 Enterprise from version 3.9.0. |
| scheme | Request scheme, such as HTTP and gRPC. |
| path | HTTP path pattern. Only available if the parameter include_path is set to true. Available in APISIX from version 3.14.0 and API7 Enterprise from version 3.9.0. |
| method | HTTP method. Only available if the attribute include_method is set to true. Available in APISIX from version 3.14.0 and API7 Enterprise from version 3.9.0. |
Examples
The examples below demonstrate how you can configure datadog plugin for different scenarios.
Before proceeding, please make sure you have installed Datadog agent which collects events and metrics from monitored objects and sends them to Datadog.
Start the Datadog agent:
- Docker
- Kubernetes
docker run -d \
  --name dogstatsd-agent \
  -e DD_API_KEY=35ebe12345678dec56218930b79fdb4cf \
  -e DD_SITE="us5.datadoghq.com" \
  -e DD_HOSTNAME=apisix.quickstart \
  -e DD_DOGSTATSD_NON_LOCAL_TRAFFIC=true \
  -p 8125:8125/udp \
  datadog/dogstatsd:latest
❶ DD_API_KEY: replace with your API key.
❷ DD_SITE: replace with your Datadog site.
❸ DD_HOSTNAME: replace with your hostname.
❹ DD_DOGSTATSD_NON_LOCAL_TRAFFIC: set to true to listen to DogStatsD packets from other containers.
Create a Kubernetes manifest file for the Datadog DogStatsD agent:
apiVersion: apps/v1
kind: Deployment
metadata:
  namespace: aic
  name: dogstatsd-agent
spec:
  replicas: 1
  selector:
    matchLabels:
      app: dogstatsd-agent
  template:
    metadata:
      labels:
        app: dogstatsd-agent
    spec:
      containers:
      - name: dogstatsd-agent
        image: datadog/dogstatsd:latest
        env:
        - name: DD_API_KEY
          value: "35ebe12345678dec56218930b79fdb4cf"
        - name: DD_SITE
          value: "us5.datadoghq.com"
        - name: DD_HOSTNAME
          value: "apisix.quickstart"
        - name: DD_DOGSTATSD_NON_LOCAL_TRAFFIC
          value: "true"
        ports:
        - containerPort: 8125
          protocol: UDP
❶ DD_API_KEY: replace with your API key.
❷ DD_SITE: replace with your Datadog site.
❸ DD_HOSTNAME: replace with your hostname.
❹ DD_DOGSTATSD_NON_LOCAL_TRAFFIC: set to true to listen to DogStatsD packets from other containers.
Create a Kubernetes manifest file for the DogStatsD service:
apiVersion: v1
kind: Service
metadata:
  namespace: aic
  name: dogstatsd-agent
spec:
  selector:
    app: dogstatsd-agent
  ports:
  - name: dogstatsd
    port: 8125
    targetPort: 8125
    protocol: UDP
  type: ClusterIP
Apply the manifests:
kubectl apply -f dogstatsd-deployment.yaml -f dogstatsd-service.yaml
You can configure most options in the agent’s main configuration file datadog.yaml through environment variables, prefixed with DD_. For more information, see agent environment variables.
Update Datadog Agent Address and Other Metadata
By default, the plugin expects the DogStatsD server to be available at 127.0.0.1:8125. To customize the address and other metadata, update the plugin metadata as such:
- Admin API
- ADC
- Ingress Controller
curl "http://127.0.0.1:9180/apisix/admin/plugin_metadata/datadog" -X PUT \
  -H "X-API-KEY: ${ADMIN_API_KEY}" \
  -d '{
    "host": "192.168.0.90",
    "port": 8125,
    "namespace": "apisix",
    "constant_tags": [
      "source:apisix",
      "service:custom"
    ]
  }'
❶ Replace with your private IP address. If you are running the Datadog agent in Kubernetes, use the service DNS name (e.g., dogstatsd-agent.aic.svc).
❷ Set to Datadog agent listening port.
❸ Set namespace which prefixes all metrics.
❹ Configure constant tags.
To reset to default configuration, send a request to the datadog plugin metadata with an empty body:
curl "http://127.0.0.1:9180/apisix/admin/plugin_metadata/datadog" -X PUT -d '{}'
plugin_metadata:
  - name: datadog
    host: "192.168.0.90"
    port: 8125
    namespace: apisix
    constant_tags:
      - "source:apisix"
      - "service:custom"
❶ Replace with your private IP address. If you are running the Datadog agent in Kubernetes, use the service DNS name (e.g., dogstatsd-agent.aic.svc).
❷ Set to Datadog agent listening port.
❸ Set namespace which prefixes all metrics.
❹ Configure constant tags.
Synchronize the configuration to the gateway:
adc sync -f adc.yaml
apiVersion: apisix.apache.org/v1alpha1
kind: GatewayProxy
metadata:
  namespace: aic
  name: apisix-config
spec:
  provider:
    type: ControlPlane
    controlPlane:
      service:
        name: apisix-admin
        port: 9180
      auth:
        type: AdminKey
        adminKey:
          value: edd1c9f034335f136f87ad84b625c8f1
  pluginMetadata:
    datadog:
      host: "dogstatsd-agent.aic.svc"
      port: 8125
      namespace: apisix
      constant_tags:
        - "source:apisix"
        - "service:custom"
❶ Set to the Datadog DogStatsD agent service DNS name in Kubernetes.
❷ Set to Datadog agent listening port.
❸ Set namespace which prefixes all metrics.
❹ Configure constant tags.
Apply the configuration:
kubectl apply -f datadog-metadata.yaml
Monitor Route Metrics
The example below shows how you can send the metrics of a particular route to Datadog.
Create a route with the datadog plugin and a few optional configuration options:
- Admin API
- ADC
- Ingress Controller
curl "http://127.0.0.1:9180/apisix/admin/routes" -X PUT \
  -H "X-API-KEY: ${ADMIN_API_KEY}" \
  -d '{
    "id": "datadog-route",
    "uri": "/anything",
    "plugins": {
      "datadog": {
        "batch_max_size" : 1,
        "max_retry_count": 0
      }
    },
    "upstream": {
      "type": "roundrobin",
      "nodes": {
        "httpbin.org": 1
      }
    }
  }'
services:
  - name: httpbin
    routes:
      - uris:
          - /anything
        name: datadog-route
        plugins:
          datadog:
            batch_max_size: 1
            max_retry_count: 0
    upstream:
      type: roundrobin
      nodes:
        - host: httpbin.org
          port: 80
          weight: 1
Synchronize the configuration to the gateway:
adc sync -f adc.yaml
- Gateway API
- APISIX CRD
apiVersion: v1
kind: Service
metadata:
  namespace: aic
  name: httpbin-external-domain
spec:
  type: ExternalName
  externalName: httpbin.org
---
apiVersion: apisix.apache.org/v1alpha1
kind: PluginConfig
metadata:
  namespace: aic
  name: datadog-plugin-config
spec:
  plugins:
    - name: datadog
      config:
        batch_max_size: 1
        max_retry_count: 0
---
apiVersion: gateway.networking.k8s.io/v1
kind: HTTPRoute
metadata:
  namespace: aic
  name: datadog-route
spec:
  parentRefs:
    - name: apisix
  rules:
    - matches:
        - path:
            type: Exact
            value: /anything
      filters:
        - type: ExtensionRef
          extensionRef:
            group: apisix.apache.org
            kind: PluginConfig
            name: datadog-plugin-config
      backendRefs:
        - name: httpbin-external-domain
          port: 80
apiVersion: apisix.apache.org/v2
kind: ApisixUpstream
metadata:
  namespace: aic
  name: httpbin-external-domain
spec:
  ingressClassName: apisix
  externalNodes:
  - type: Domain
    name: httpbin.org
---
apiVersion: apisix.apache.org/v2
kind: ApisixRoute
metadata:
  namespace: aic
  name: datadog-route
spec:
  ingressClassName: apisix
  http:
    - name: datadog-route
      match:
        paths:
          - /anything
        methods:
          - GET
      upstreams:
        - name: httpbin-external-domain
      plugins:
        - name: datadog
          config:
            batch_max_size: 1
            max_retry_count: 0
Apply the configuration:
kubectl apply -f datadog-ic.yaml
❶ batch_max_size: set to 1 to send the metric immediately.
❷ max_retry_count: set to 0 to disallow retries if metrics were unsuccessfully sent.
Generate a few requests to the previously created route:
curl "http://127.0.0.1:9080/anything"
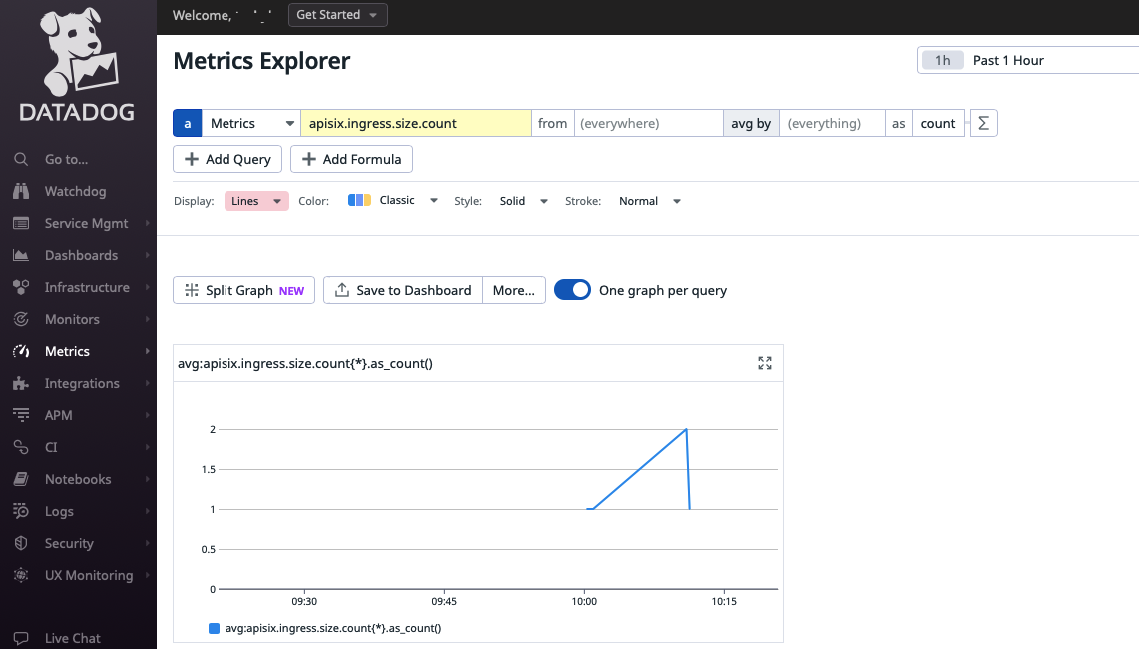
In Datadog, Select Metrics from the left menu and go to Explorer. Select apisix.ingress.size.count as the metric. You should see the count reflecting the number of requests generated: