skywalking-logger
The skywalking-logger plugin pushes request and response logs as JSON objects to SkyWalking OAP server in batches and supports the customization of log formats.
If there is an existing tracing context, it sets up the trace-log correlation automatically and relies on SkyWalking Cross Process Propagation Headers Protocol.
Examples
The examples below demonstrate how you can configure skywalking-logger plugin for different scenarios.
- Docker
- Kubernetes
To follow along the example, start a storage, OAP and Booster UI with Docker Compose, following SkyWalking's documentation. Once set up, the OAP server should be listening on 12800 and you should be able to access the UI at http://localhost:8080.
To follow along the example, deploy SkyWalking OAP server and UI to your Kubernetes cluster following SkyWalking's documentation. For a quick start, you can use the SkyWalking Helm chart.
Once deployed, the OAP server is typically accessible at skywalking-oap.skywalking.svc.cluster.local:12800 within the cluster.
Log Requests in Default Log Format
The following example demonstrates how you can configure the skywalking-logger plugin on a route to log information of requests hitting the route.
Create a route with the skywalking-logger plugin and configure the plugin with your OAP server URI:
- Admin API
- ADC
- Ingress Controller
curl "http://127.0.0.1:9180/apisix/admin/routes" -X PUT \
  -H "X-API-KEY: ${ADMIN_API_KEY}" \
  -d '{
    "id": "skywalking-logger-route",
    "uri": "/anything",
    "plugins": {
      "skywalking-logger": {
        "endpoint_addr": "http://192.168.2.103:12800"
      }
    },
    "upstream": {
      "nodes": {
        "httpbin.org:80": 1
      },
      "type": "roundrobin"
    }
  }'
services:
  - name: httpbin
    routes:
      - uris:
          - /anything
        name: skywalking-logger-route
        plugins:
          skywalking-logger:
            endpoint_addr: "http://192.168.2.103:12800"
    upstream:
      type: roundrobin
      nodes:
        - host: httpbin.org
          port: 80
          weight: 1
Synchronize the configuration to the gateway:
adc sync -f adc.yaml
- Gateway API
- APISIX CRD
apiVersion: v1
kind: Service
metadata:
  namespace: aic
  name: httpbin-external-domain
spec:
  type: ExternalName
  externalName: httpbin.org
---
apiVersion: apisix.apache.org/v1alpha1
kind: PluginConfig
metadata:
  namespace: aic
  name: skywalking-logger-plugin-config
spec:
  plugins:
    - name: skywalking-logger
      config:
        endpoint_addr: "http://skywalking-oap.skywalking.svc.cluster.local:12800"
---
apiVersion: gateway.networking.k8s.io/v1
kind: HTTPRoute
metadata:
  namespace: aic
  name: skywalking-logger-route
spec:
  parentRefs:
    - name: apisix
  rules:
    - matches:
        - path:
            type: Exact
            value: /anything
      filters:
        - type: ExtensionRef
          extensionRef:
            group: apisix.apache.org
            kind: PluginConfig
            name: skywalking-logger-plugin-config
      backendRefs:
        - name: httpbin-external-domain
          port: 80
apiVersion: apisix.apache.org/v2
kind: ApisixUpstream
metadata:
  namespace: aic
  name: httpbin-external-domain
spec:
  ingressClassName: apisix
  externalNodes:
  - type: Domain
    name: httpbin.org
---
apiVersion: apisix.apache.org/v2
kind: ApisixRoute
metadata:
  namespace: aic
  name: skywalking-logger-route
spec:
  ingressClassName: apisix
  http:
    - name: skywalking-logger-route
      match:
        paths:
          - /anything
      upstreams:
      - name: httpbin-external-domain
      plugins:
      - name: skywalking-logger
        enable: true
        config:
          endpoint_addr: "http://skywalking-oap.skywalking.svc.cluster.local:12800"
Apply the configuration to your cluster:
kubectl apply -f skywalking-logger-ic.yaml
Send a request to the route:
curl -i "http://127.0.0.1:9080/anything"
You should receive an HTTP/1.1 200 OK response.
In SkyWalking UI, navigate to General Service > Services. You should see a service called APISIX with a log entry corresponding to your request:
{
  "upstream_latency": 674,
  "request": {
    "method": "GET",
    "headers": {
      "user-agent": "curl/8.6.0",
      "host": "127.0.0.1:9080",
      "accept": "*/*"
    },
    "url": "http://127.0.0.1:9080/anything",
    "size": 85,
    "querystring": {},
    "uri": "/anything"
  },
  "client_ip": "192.168.65.1",
  "route_id": "skywalking-logger-route",
  "start_time": 1736945107345,
  "upstream": "3.210.94.60:80",
  "server": {
    "version": "3.13.0",
    "hostname": "7edbcebe8eb3"
  },
  "service_id": "",
  "response": {
    "size": 619,
    "status": 200,
    "headers": {
      "content-type": "application/json",
      "date": "Thu, 16 Jan 2025 12:45:08 GMT",
      "server": "APISIX/3.13.0",
      "access-control-allow-origin": "*",
      "connection": "close",
      "access-control-allow-credentials": "true",
      "content-length": "391"
    }
  },
  "latency": 764.9998664856,
  "apisix_latency": 90.999866485596
}
Log Request and Response Headers With Plugin Metadata
The following example demonstrates how you can customize log format using plugin metadata and built-in variables to log specific headers from request and response.
In APISIX, plugin metadata is used to configure the common metadata fields of all plugin instances of the same plugin. It is useful when a plugin is enabled across multiple resources and requires a universal update to their metadata fields.
First, create a route with the skywalking-logger plugin and configure the plugin with your OAP server URI (same as Log Requests in Default Log Format).
Next, configure the plugin metadata for skywalking-logger:
- Admin API
- ADC
- Ingress Controller
curl "http://127.0.0.1:9180/apisix/admin/plugin_metadata/skywalking-logger" -X PUT \
  -H "X-API-KEY: ${ADMIN_API_KEY}" \
  -d '{
    "log_format": {
      "host": "$host",
      "@timestamp": "$time_iso8601",
      "client_ip": "$remote_addr",
      "env": "$http_env",
      "resp_content_type": "$sent_http_Content_Type"
    }
  }'
plugin_metadata:
  - name: skywalking-logger
    log_format:
      host: "$host"
      "@timestamp": "$time_iso8601"
      client_ip: "$remote_addr"
      env: "$http_env"
      resp_content_type: "$sent_http_Content_Type"
Synchronize the configuration to the gateway:
adc sync -f adc.yaml
Update the pluginMetadata field in your existing GatewayProxy resource:
apiVersion: apisix.apache.org/v1alpha1
kind: GatewayProxy
metadata:
  namespace: aic
  name: apisix-config
spec:
  provider:
    type: ControlPlane
    controlPlane:
      # your control plane connection configuration
      # ....
  pluginMetadata:
    skywalking-logger:
      log_format:
        host: "$host"
        "@timestamp": "$time_iso8601"
        client_ip: "$remote_addr"
        env: "$http_env"
        resp_content_type: "$sent_http_Content_Type"
Apply the configuration to your cluster:
kubectl apply -f gateway-proxy.yaml
❶ Log the custom request header env.
❷ Log the response header Content-Type.
Send a request to the route with the env header:
curl -i "http://127.0.0.1:9080/anything" -H "env: dev"
You should receive an HTTP/1.1 200 OK response. In SkyWalking UI, navigate to General Service > Services. You should see a service called APISIX with a log entry corresponding to your request:
[
  {
    "route_id": "skywalking-logger-route",
    "client_ip": "192.168.65.1",
    "@timestamp": "2025-01-16T12:51:53+00:00",
    "host": "127.0.0.1",
    "env": "dev",
    "resp_content_type": "application/json"
  }
]
Log Request Bodies Conditionally
The following example demonstrates how you can conditionally log request body.
Create a route with the skywalking-logger plugin as follows:
- Admin API
- ADC
- Ingress Controller
curl "http://127.0.0.1:9180/apisix/admin/routes" -X PUT \
  -H "X-API-KEY: ${ADMIN_API_KEY}" \
  -d '{
    "id": "skywalking-logger-route",
    "uri": "/anything",
    "plugins": {
      "skywalking-logger": {
        "endpoint_addr": "http://192.168.2.103:12800",
        "include_req_body": true,
        "include_req_body_expr": [["arg_log_body", "==", "yes"]]
      }
    },
    "upstream": {
      "nodes": {
        "httpbin.org:80": 1
      },
      "type": "roundrobin"
    }
  }'
services:
  - name: httpbin
    routes:
      - uris:
          - /anything
        name: skywalking-logger-route
        plugins:
          skywalking-logger:
            endpoint_addr: "http://192.168.2.103:12800"
            include_req_body: true
            include_req_body_expr:
              - ["arg_log_body", "==", "yes"]
    upstream:
      type: roundrobin
      nodes:
        - host: httpbin.org
          port: 80
          weight: 1
Synchronize the configuration to the gateway:
adc sync -f adc.yaml
- Gateway API
- APISIX CRD
apiVersion: v1
kind: Service
metadata:
  namespace: aic
  name: httpbin-external-domain
spec:
  type: ExternalName
  externalName: httpbin.org
---
apiVersion: apisix.apache.org/v1alpha1
kind: PluginConfig
metadata:
  namespace: aic
  name: skywalking-logger-body-config
spec:
  plugins:
    - name: skywalking-logger
      config:
        endpoint_addr: "http://skywalking-oap.skywalking.svc.cluster.local:12800"
        include_req_body: true
        include_req_body_expr:
          - ["arg_log_body", "==", "yes"]
---
apiVersion: gateway.networking.k8s.io/v1
kind: HTTPRoute
metadata:
  namespace: aic
  name: skywalking-logger-route
spec:
  parentRefs:
    - name: apisix
  rules:
    - matches:
        - path:
            type: Exact
            value: /anything
      filters:
        - type: ExtensionRef
          extensionRef:
            group: apisix.apache.org
            kind: PluginConfig
            name: skywalking-logger-body-config
      backendRefs:
        - name: httpbin-external-domain
          port: 80
apiVersion: apisix.apache.org/v2
kind: ApisixUpstream
metadata:
  namespace: aic
  name: httpbin-external-domain
spec:
  ingressClassName: apisix
  externalNodes:
  - type: Domain
    name: httpbin.org
---
apiVersion: apisix.apache.org/v2
kind: ApisixRoute
metadata:
  namespace: aic
  name: skywalking-logger-route
spec:
  ingressClassName: apisix
  http:
    - name: skywalking-logger-route
      match:
        paths:
          - /anything
      upstreams:
      - name: httpbin-external-domain
      plugins:
      - name: skywalking-logger
        enable: true
        config:
          endpoint_addr: "http://skywalking-oap.skywalking.svc.cluster.local:12800"
          include_req_body: true
          include_req_body_expr:
            - ["arg_log_body", "==", "yes"]
Apply the configuration to your cluster:
kubectl apply -f skywalking-logger-body-ic.yaml
❶ include_req_body: Set to true to include request body.
❷ include_req_body_expr: Only include request body if the URL query string log_body is yes.
Send a request to the route with a URL query string satisfying the condition:
curl -i "http://127.0.0.1:9080/anything?log_body=yes" -X POST -d '{"env": "dev"}'
You should receive an HTTP/1.1 200 OK response. In SkyWalking UI, navigate to General Service > Services. You should see a service called APISIX with a log entry corresponding to your request, with the request body logged:
[
  {
    "request": {
      "url": "http://127.0.0.1:9080/anything?log_body=yes",
      "querystring": {
        "log_body": "yes"
      },
      "uri": "/anything?log_body=yes",
      ...,
      "body": "{\"env\": \"dev\"}",
    },
    ...
  }
]
Send a request to the route without any URL query string:
curl -i "http://127.0.0.1:9080/anything" -X POST -d '{"env": "dev"}'
You should not observe a log entry without the request body.
If you have customized the log_format in addition to setting include_req_body or include_resp_body to true, the plugin would not include the bodies in the logs.
As a workaround, you may be able to use the NGINX variable $request_body in the log format, such as:
{
  "skywalking-logger": {
    ...,
    "log_format": {"body": "$request_body"}
  }
}
Associate Traces with Logs
The following example demonstrates how you can configure the skywalking-logger plugin on a route to log information of requests hitting the route.
This example also requires the skywalking plugin to be enabled globally and configured with a reachable OAP endpoint address. For Helm deployments, see the SkyWalking plugin setup.
Create a route with the skywalking-logger plugin and configure the plugin with your OAP server URI:
- Admin API
- ADC
- Ingress Controller
curl "http://127.0.0.1:9180/apisix/admin/routes" -X PUT \
  -H "X-API-KEY: ${ADMIN_API_KEY}" \
  -d '{
    "id": "skywalking-logger-route",
    "uri": "/anything",
    "plugins": {
      "skywalking": {
        "sample_ratio": 1
      },
      "skywalking-logger": {
        "endpoint_addr": "http://192.168.2.103:12800"
      }
    },
    "upstream": {
      "nodes": {
        "httpbin.org:80": 1
      },
      "type": "roundrobin"
    }
  }'
services:
  - name: httpbin
    routes:
      - uris:
          - /anything
        name: skywalking-logger-route
        plugins:
          skywalking:
            sample_ratio: 1
          skywalking-logger:
            endpoint_addr: "http://192.168.2.103:12800"
    upstream:
      type: roundrobin
      nodes:
        - host: httpbin.org
          port: 80
          weight: 1
Synchronize the configuration to the gateway:
adc sync -f adc.yaml
- Gateway API
- APISIX CRD
apiVersion: v1
kind: Service
metadata:
  namespace: aic
  name: httpbin-external-domain
spec:
  type: ExternalName
  externalName: httpbin.org
---
apiVersion: apisix.apache.org/v1alpha1
kind: PluginConfig
metadata:
  namespace: aic
  name: skywalking-logger-trace-config
spec:
  plugins:
    - name: skywalking
      config:
        sample_ratio: 1
    - name: skywalking-logger
      config:
        endpoint_addr: "http://skywalking-oap.skywalking.svc.cluster.local:12800"
---
apiVersion: gateway.networking.k8s.io/v1
kind: HTTPRoute
metadata:
  namespace: aic
  name: skywalking-logger-route
spec:
  parentRefs:
    - name: apisix
  rules:
    - matches:
        - path:
            type: Exact
            value: /anything
      filters:
        - type: ExtensionRef
          extensionRef:
            group: apisix.apache.org
            kind: PluginConfig
            name: skywalking-logger-trace-config
      backendRefs:
        - name: httpbin-external-domain
          port: 80
apiVersion: apisix.apache.org/v2
kind: ApisixUpstream
metadata:
  namespace: aic
  name: httpbin-external-domain
spec:
  ingressClassName: apisix
  externalNodes:
  - type: Domain
    name: httpbin.org
---
apiVersion: apisix.apache.org/v2
kind: ApisixRoute
metadata:
  namespace: aic
  name: skywalking-logger-route
spec:
  ingressClassName: apisix
  http:
    - name: skywalking-logger-route
      match:
        paths:
          - /anything
      upstreams:
      - name: httpbin-external-domain
      plugins:
      - name: skywalking
        enable: true
        config:
          sample_ratio: 1
      - name: skywalking-logger
        enable: true
        config:
          endpoint_addr: "http://skywalking-oap.skywalking.svc.cluster.local:12800"
Apply the configuration to your cluster:
kubectl apply -f skywalking-logger-trace-ic.yaml
Generate a few requests to the route:
curl -i "http://127.0.0.1:9080/anything"
You should receive HTTP/1.1 200 OK responses.
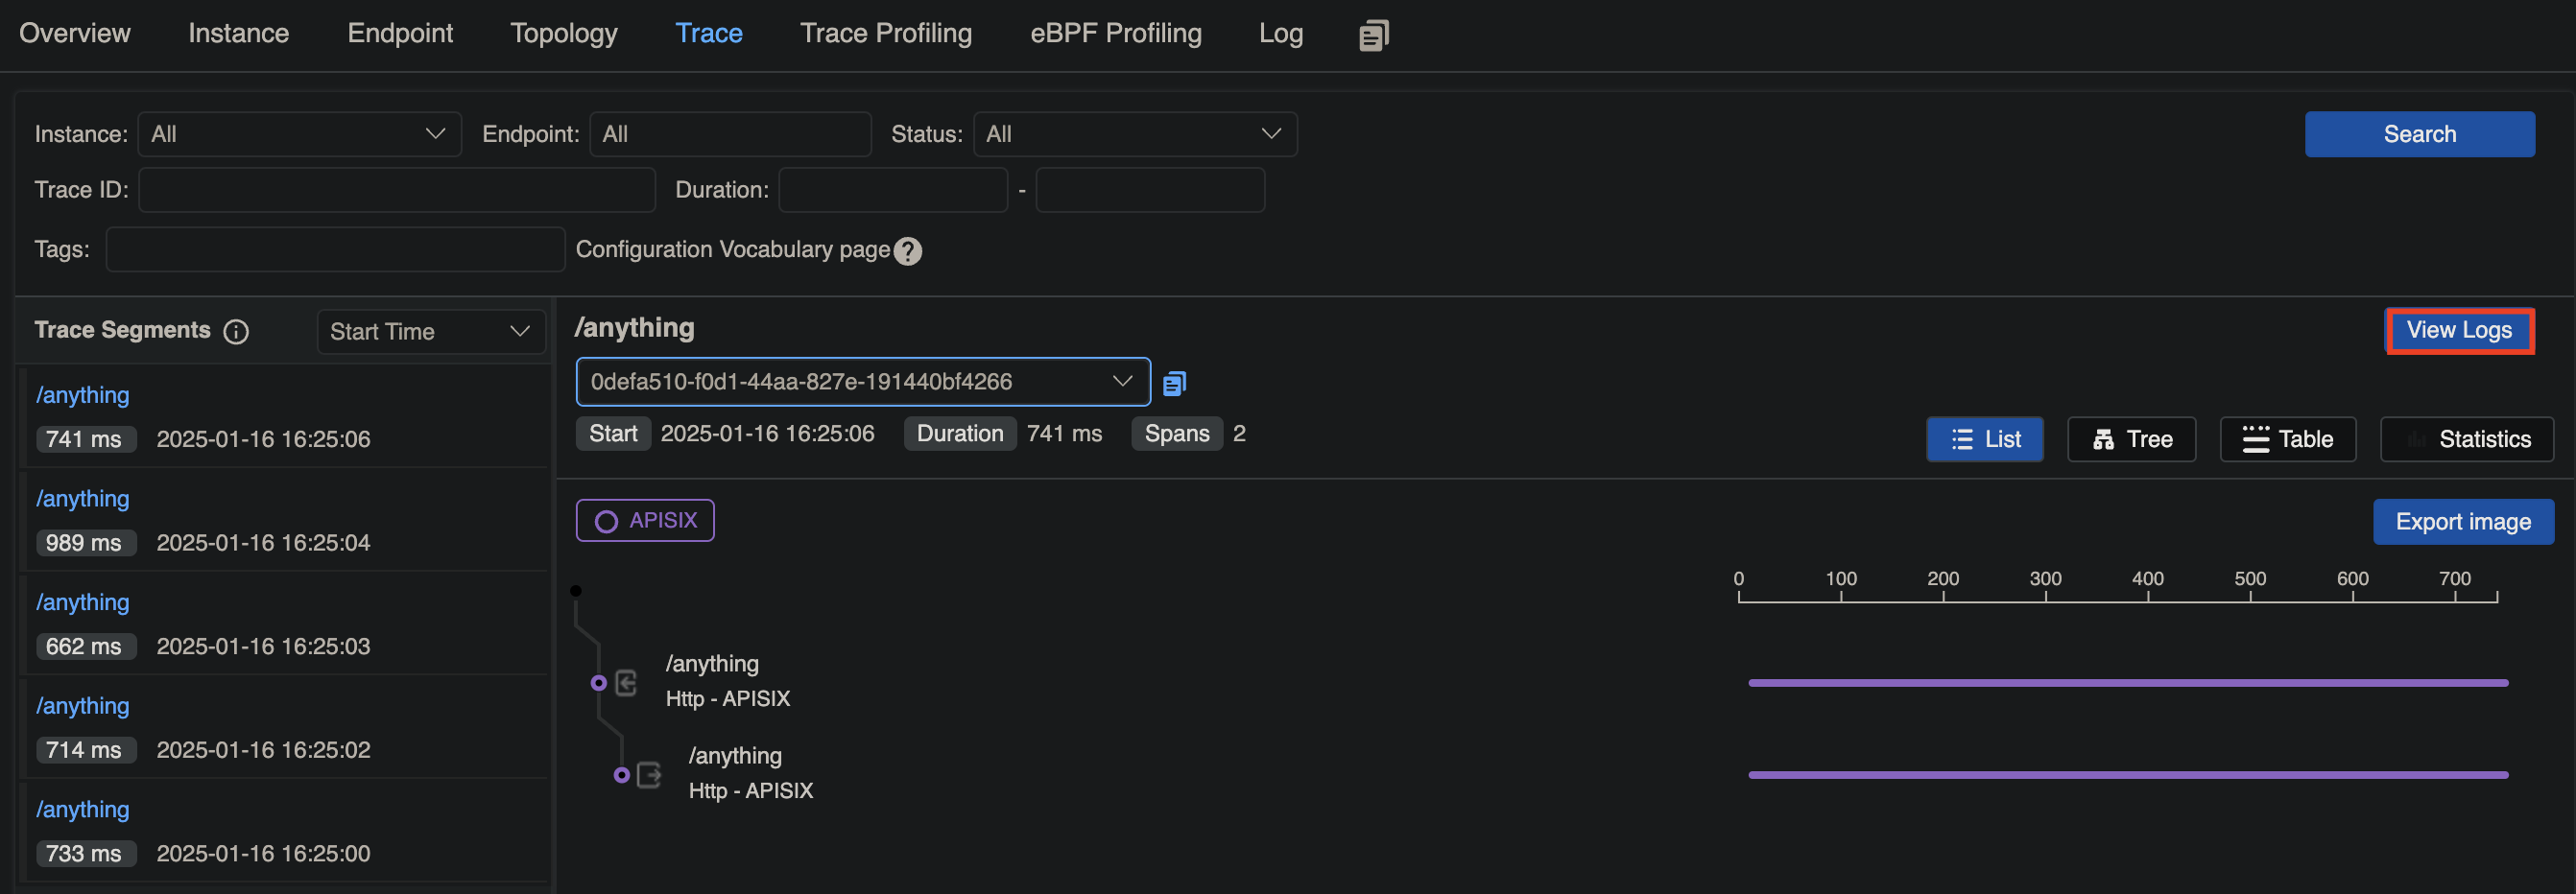
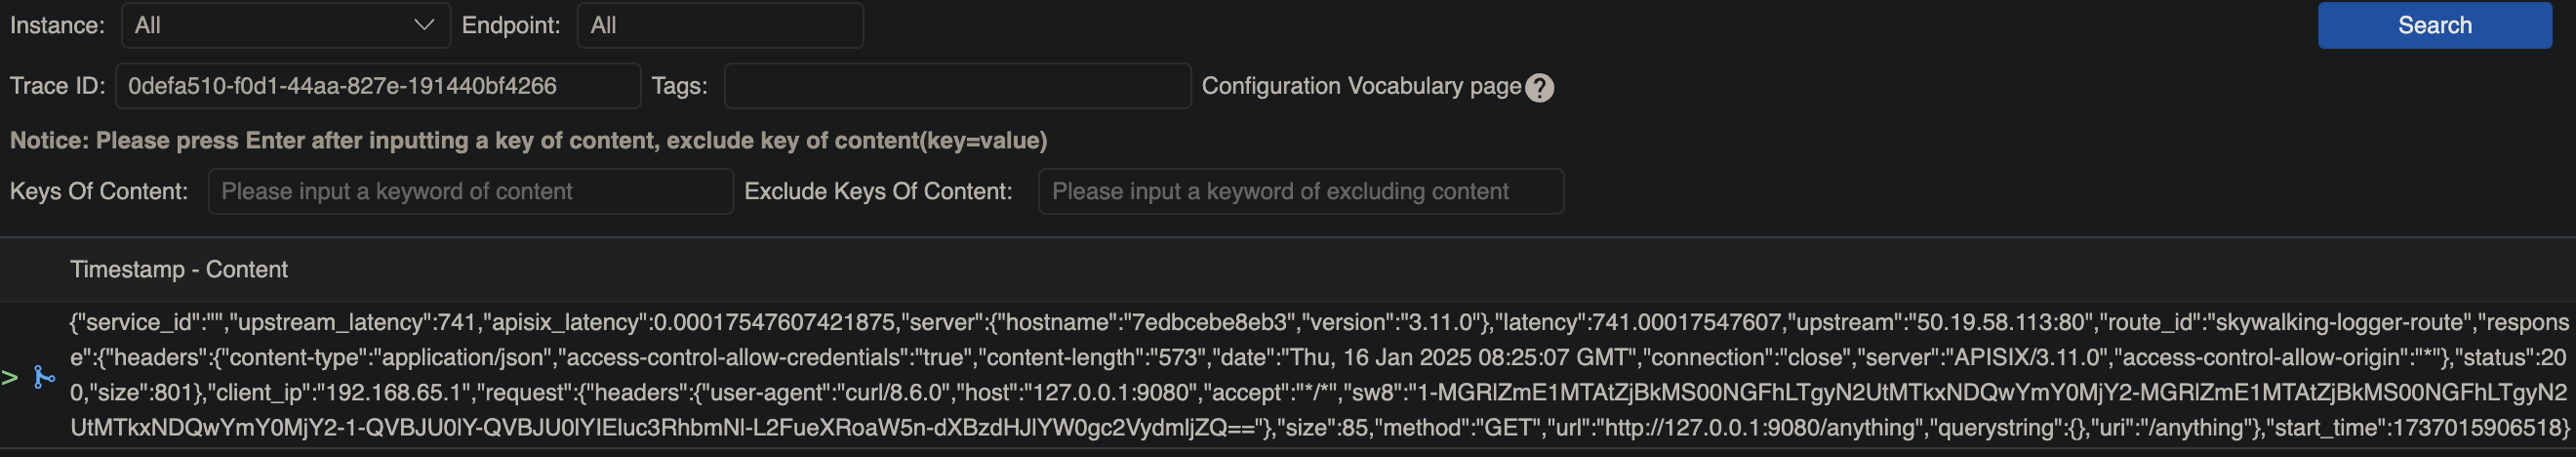
In SkyWalking UI, navigate to General Service > Services. You should see a service called APISIX with a trace corresponding to your request, where you can view the associated logs: