
zipkin
Zipkin is an open-source distributed tracing system. The zipkin plugin instruments gateway requests and sends sampled spans to a collector through the Zipkin v2 HTTP API.
The plugin also works with collectors that expose a compatible Zipkin v2 endpoint, such as Jaeger and Apache SkyWalking.
Tracing adds work to each sampled request. Use sample_ratio to balance trace coverage against that overhead, and use a lower ratio on high-throughput routes when full sampling is unnecessary. Requests excluded by sampling do not build span tags. Measure the effect with your traffic and collector configuration rather than assuming a fixed performance improvement.
Examples
The examples below configure the zipkin plugin with Zipkin and Jaeger collectors, compare its two span hierarchies, and expose trace identifiers to access logs.
The collector deployments below use transient in-memory storage without authentication or TLS. For production, configure durable storage and secure the collector endpoint, then update the plugin endpoint accordingly.
Send Traces to Zipkin
The plugin always sends Zipkin v2 JSON to the configured endpoint. Its span_version setting controls how the gateway divides request processing into spans; it does not change the Zipkin wire format. This example sends traces to Zipkin and compares both supported span hierarchies.
Start a Zipkin instance:
- Docker
- Kubernetes
Set GATEWAY_CONTAINER to the name of the running APISIX or API7 Gateway container. Create a dedicated network and connect the gateway to it:
export GATEWAY_CONTAINER=replace-with-gateway-container-name

docker network create gateway-zipkin-net
docker network connect gateway-zipkin-net "$GATEWAY_CONTAINER"
Start Zipkin on the same network and publish its HTTP service only on the loopback interface:
docker run -d --name zipkin \
  --network gateway-zipkin-net \
  -p 127.0.0.1:9411:9411 \
  openzipkin/zipkin:3.6.1
Wait for Zipkin to become ready:
until curl -fsS "http://127.0.0.1:9411/health" > /dev/null; do
  sleep 1
done
apiVersion: apps/v1
kind: Deployment
metadata:
  namespace: aic
  name: zipkin
spec:
  replicas: 1
  selector:
    matchLabels:
      app: zipkin
  template:
    metadata:
      labels:
        app: zipkin
    spec:
      containers:
        - name: zipkin
          image: openzipkin/zipkin:3.6.1
          ports:
            - containerPort: 9411
          readinessProbe:
            httpGet:
              path: /health
              port: 9411
---
apiVersion: v1
kind: Service
metadata:
  namespace: aic
  name: zipkin
spec:
  selector:
    app: zipkin
  ports:
    - name: http
      port: 9411
      targetPort: 9411
Apply the manifest:
kubectl apply -f zipkin-server.yaml
Wait for Zipkin to become available:
kubectl rollout status -n aic deployment/zipkin
Create a route with zipkin and use the default span version 2:
- Admin API
- ADC
- Ingress Controller
curl "http://127.0.0.1:9180/apisix/admin/routes/zipkin-tracing-route" -X PUT \
  -H "X-API-KEY: ${ADMIN_API_KEY}" \
  -d '{
    "uri": "/anything",
    "plugins": {
      "zipkin": {
        "endpoint": "http://zipkin:9411/api/v2/spans",
        "sample_ratio": 1,
        "span_version": 2
      }
    },
    "upstream": {
      "type": "roundrobin",
      "nodes": {
        "httpbin.org": 1
      }
    }
  }'
services:
  - name: httpbin
    routes:
      - uris:
          - /anything
        name: zipkin-tracing-route
        plugins:
          zipkin:
            endpoint: "http://zipkin:9411/api/v2/spans"
            sample_ratio: 1
            span_version: 2
    upstream:
      type: roundrobin
      nodes:
        - host: httpbin.org
          port: 80
          weight: 1
ADC reconciles services as desired state. The label selector limits this example to its own labeled resources. Preview the scoped changes and confirm that they contain no unintended updates or deletions:
adc diff -f adc.yaml \
  --include-resource-type service \
  --label-selector docs-example=zipkin-tracing
Synchronize the reviewed service configuration:
adc sync -f adc.yaml \
  --include-resource-type service \
  --label-selector docs-example=zipkin-tracing
- Gateway API
- APISIX CRD
apiVersion: v1
kind: Service
metadata:
  namespace: aic
  name: httpbin-external-domain
spec:
  type: ExternalName
  externalName: httpbin.org
---
apiVersion: apisix.apache.org/v1alpha1
kind: PluginConfig
metadata:
  namespace: aic
  name: zipkin-plugin-config
spec:
  plugins:
    - name: zipkin
      config:
        endpoint: "http://zipkin.aic.svc.cluster.local:9411/api/v2/spans"
        sample_ratio: 1
        span_version: 2
---
apiVersion: gateway.networking.k8s.io/v1
kind: HTTPRoute
metadata:
  namespace: aic
  name: zipkin-route
spec:
  parentRefs:
    - name: apisix
  rules:
    - matches:
        - path:
            type: Exact
            value: /anything
      filters:
        - type: ExtensionRef
          extensionRef:
            group: apisix.apache.org
            kind: PluginConfig
            name: zipkin-plugin-config
      backendRefs:
        - name: httpbin-external-domain
          port: 80
apiVersion: apisix.apache.org/v2
kind: ApisixUpstream
metadata:
  namespace: aic
  name: httpbin-external-domain
spec:
  ingressClassName: apisix
  externalNodes:
  - type: Domain
    name: httpbin.org
---
apiVersion: apisix.apache.org/v2
kind: ApisixRoute
metadata:
  namespace: aic
  name: zipkin-route
spec:
  ingressClassName: apisix
  http:
    - name: zipkin-route
      match:
        paths:
          - /anything
      upstreams:
      - name: httpbin-external-domain
      plugins:
      - name: zipkin
        enable: true
        config:
          endpoint: "http://zipkin.aic.svc.cluster.local:9411/api/v2/spans"
          sample_ratio: 1
          span_version: 2
Apply the configuration to your cluster:
kubectl apply -f zipkin-ic.yaml
❶ Send spans to the collector's Zipkin v2 HTTP endpoint. The Docker and Kubernetes examples use addresses that are reachable from the gateway.
❷ Trace every request for this example. Use a lower ratio in environments where full sampling is unnecessary.
❸ Use the default span hierarchy.
Send a request to the route:
curl "http://127.0.0.1:9080/anything"
You should receive an HTTP/1.1 200 OK response similar to the following:
{
  "args": {},
  "data": "",
  "files": {},
  "form": {},
  "headers": {
    "Accept": "*/*",
    "Host": "127.0.0.1",
    "User-Agent": "curl/8.7.1",
    "X-Amzn-Trace-Id": "Root=1-6aa8b24c-29cf898f18bbdf415ccd7b42",
    "X-B3-Parentspanid": "e1a7df5f617b3a04",
    "X-B3-Sampled": "1",
    "X-B3-Spanid": "c3a11943cd04ec70",
    "X-B3-Traceid": "b06793db23230f51187a9638e08fb772",
    "X-Forwarded-Host": "127.0.0.1:9080"
  },
  "json": null,
  "method": "GET",
  "url": "http://127.0.0.1:9080/anything"
}
For Kubernetes, make the Zipkin UI available locally in a separate terminal session:
kubectl port-forward -n aic service/zipkin 9411:9411
Wait until the asynchronously exported trace is available:
until curl -fsS \
  "http://127.0.0.1:9411/api/v2/traces?serviceName=apisix&limit=10" | \
  grep -q '"traceId"'; do
  sleep 1
done
Navigate to the Zipkin web UI at http://127.0.0.1:9411/zipkin and select Run Query. You should see a trace corresponding to the request:

Select Show to see the span details:
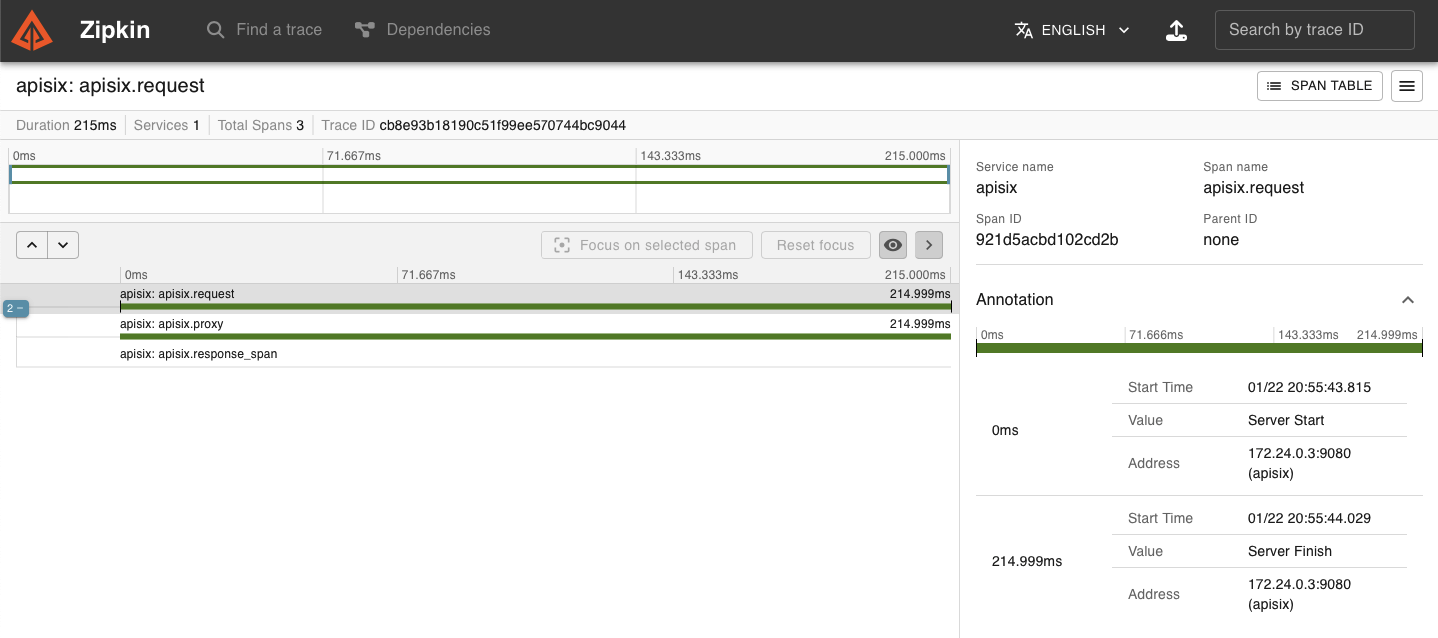
For the successfully proxied request in this example, span_version: 2 produces the following spans:
apisix.request
├── apisix.proxy
└── apisix.response_span
The apisix.proxy span covers the beginning of the request through the start of the NGINX header_filter phase. The apisix.response_span span covers the start of header_filter through the start of the log phase.
The request span includes an apisix.response_source tag. It classifies the response origin as apisix (generated by the gateway, such as plugin rejections), nginx (NGINX proxy errors), or upstream (real response from the upstream service). Introduced in API7 Enterprise 3.9.10 and APISIX 3.17.0.
Now, update the plugin on the route to use span version 1:
- Admin API
- ADC
- Ingress Controller
curl "http://127.0.0.1:9180/apisix/admin/routes/zipkin-tracing-route" -X PATCH \
  -H "X-API-KEY: ${ADMIN_API_KEY}" \
  -d '{
    "plugins": {
      "zipkin": {
        "span_version": 1
      }
    }
  }'
Update adc.yaml to set span_version to 1:
services:
  - name: httpbin
    routes:
      - uris:
          - /anything
        name: zipkin-tracing-route
        plugins:
          zipkin:
            endpoint: "http://zipkin:9411/api/v2/spans"
            sample_ratio: 1
            span_version: 1
    upstream:
      type: roundrobin
      nodes:
        - host: httpbin.org
          port: 80
          weight: 1
ADC reconciles services as desired state. The label selector limits this example to its own labeled resources. Preview the scoped changes and confirm that they contain no unintended updates or deletions:
adc diff -f adc.yaml \
  --include-resource-type service \
  --label-selector docs-example=zipkin-tracing
Synchronize the reviewed service configuration:
adc sync -f adc.yaml \
  --include-resource-type service \
  --label-selector docs-example=zipkin-tracing
- Gateway API
- APISIX CRD
Update zipkin-ic.yaml to set span_version to 1:
apiVersion: v1
kind: Service
metadata:
  namespace: aic
  name: httpbin-external-domain
spec:
  type: ExternalName
  externalName: httpbin.org
---
apiVersion: apisix.apache.org/v1alpha1
kind: PluginConfig
metadata:
  namespace: aic
  name: zipkin-plugin-config
spec:
  plugins:
    - name: zipkin
      config:
        endpoint: "http://zipkin.aic.svc.cluster.local:9411/api/v2/spans"
        sample_ratio: 1
        span_version: 1
---
apiVersion: gateway.networking.k8s.io/v1
kind: HTTPRoute
metadata:
  namespace: aic
  name: zipkin-route
spec:
  parentRefs:
    - name: apisix
  rules:
    - matches:
        - path:
            type: Exact
            value: /anything
      filters:
        - type: ExtensionRef
          extensionRef:
            group: apisix.apache.org
            kind: PluginConfig
            name: zipkin-plugin-config
      backendRefs:
        - name: httpbin-external-domain
          port: 80
Update zipkin-ic.yaml to set span_version to 1:
apiVersion: apisix.apache.org/v2
kind: ApisixUpstream
metadata:
  namespace: aic
  name: httpbin-external-domain
spec:
  ingressClassName: apisix
  externalNodes:
  - type: Domain
    name: httpbin.org
---
apiVersion: apisix.apache.org/v2
kind: ApisixRoute
metadata:
  namespace: aic
  name: zipkin-route
spec:
  ingressClassName: apisix
  http:
    - name: zipkin-route
      match:
        paths:
          - /anything
      upstreams:
      - name: httpbin-external-domain
      plugins:
      - name: zipkin
        enable: true
        config:
          endpoint: "http://zipkin.aic.svc.cluster.local:9411/api/v2/spans"
          sample_ratio: 1
          span_version: 1
Reapply the configuration:
kubectl apply -f zipkin-ic.yaml
Send another request to the route:
curl "http://127.0.0.1:9080/anything"
Wait for the new trace to become available, then open it in the Zipkin UI. Its span hierarchy should resemble the following screenshot:
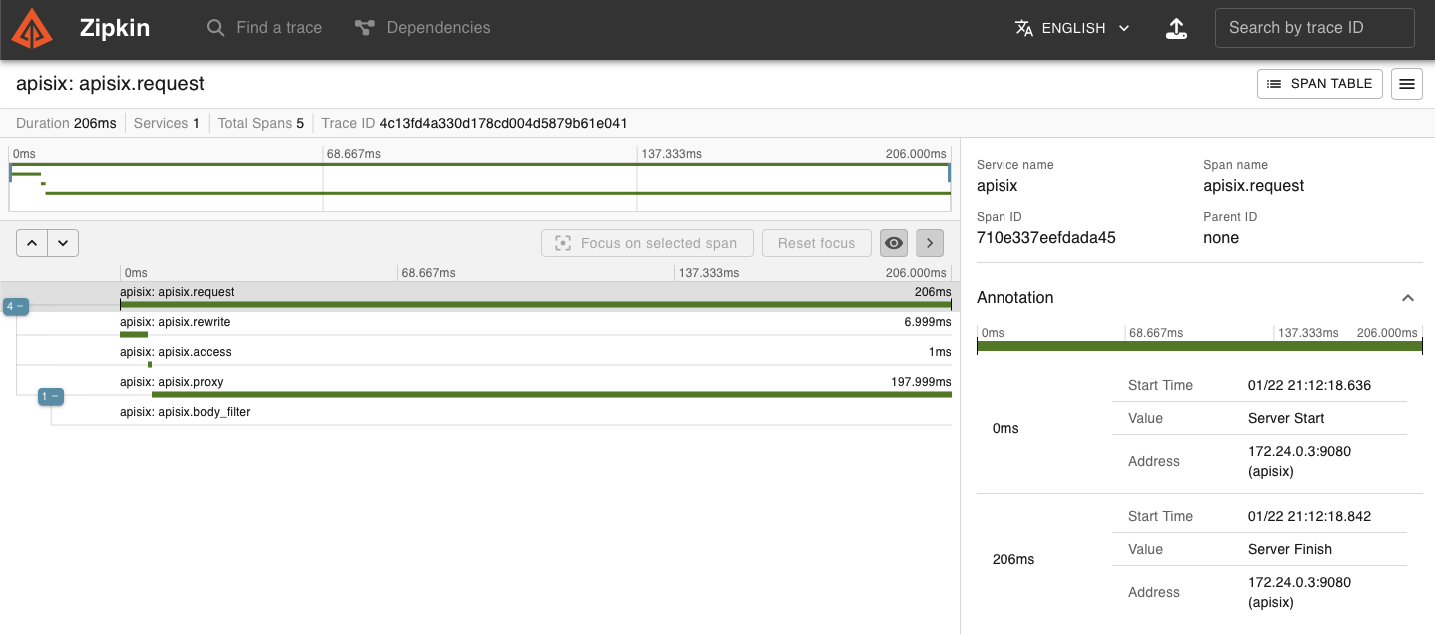
For the successfully proxied request in this example, span_version: 1 produces the following spans. The endpoint remains /api/v2/spans because the setting changes only the gateway span hierarchy:
apisix.request
├── apisix.rewrite
├── apisix.access
└── apisix.proxy
    └── apisix.body_filter
Send Traces to Jaeger
Jaeger v2 includes a Zipkin receiver in its all-in-one configuration. The following example sends spans to Jaeger through its Zipkin v2 receiver for storage and visualization.
Start a Jaeger instance:
- Docker
- Kubernetes
Set GATEWAY_CONTAINER to the name of the running APISIX or API7 Gateway container. Create a dedicated network and connect the gateway to it:
export GATEWAY_CONTAINER=replace-with-gateway-container-name

docker network create gateway-jaeger-net
docker network connect gateway-jaeger-net "$GATEWAY_CONTAINER"
Start Jaeger on the same network and publish its UI only on the loopback interface:
docker run -d --name jaeger \
  --network gateway-jaeger-net \
  -p 127.0.0.1:16686:16686 \
  cr.jaegertracing.io/jaegertracing/jaeger:2.20.0
Wait for Jaeger to become ready:
until curl -fsS "http://127.0.0.1:16686/" > /dev/null; do
  sleep 1
done
apiVersion: apps/v1
kind: Deployment
metadata:
  namespace: aic
  name: jaeger
spec:
  replicas: 1
  selector:
    matchLabels:
      app: jaeger
  template:
    metadata:
      labels:
        app: jaeger
    spec:
      containers:
        - name: jaeger
          image: cr.jaegertracing.io/jaegertracing/jaeger:2.20.0
          ports:
            - containerPort: 16686
            - containerPort: 9411
          readinessProbe:
            httpGet:
              path: /
              port: 16686
---
apiVersion: v1
kind: Service
metadata:
  namespace: aic
  name: jaeger
spec:
  selector:
    app: jaeger
  ports:
    - name: ui
      port: 16686
      targetPort: 16686
    - name: zipkin
      port: 9411
      targetPort: 9411
Apply the manifest:
kubectl apply -f jaeger-server.yaml
Wait for Jaeger to become available:
kubectl rollout status -n aic deployment/jaeger
Create a route with zipkin:
- Admin API
- ADC
- Ingress Controller
curl "http://127.0.0.1:9180/apisix/admin/routes/zipkin-jaeger-route" -X PUT \
  -H "X-API-KEY: ${ADMIN_API_KEY}" \
  -d '{
    "uri": "/anything/jaeger",
    "plugins": {
      "zipkin": {
        "endpoint": "http://jaeger:9411/api/v2/spans",
        "sample_ratio": 1
      }
    },
    "upstream": {
      "type": "roundrobin",
      "nodes": {
        "httpbin.org": 1
      }
    }
  }'
services:
  - name: httpbin
    routes:
      - uris:
          - /anything/jaeger
        name: zipkin-jaeger-route
        plugins:
          zipkin:
            endpoint: "http://jaeger:9411/api/v2/spans"
            sample_ratio: 1
    upstream:
      type: roundrobin
      nodes:
        - host: httpbin.org
          port: 80
          weight: 1
ADC reconciles services as desired state. The label selector limits this example to its own labeled resources. Preview the scoped changes and confirm that they contain no unintended updates or deletions:
adc diff -f adc.yaml \
  --include-resource-type service \
  --label-selector docs-example=zipkin-tracing
Synchronize the reviewed service configuration:
adc sync -f adc.yaml \
  --include-resource-type service \
  --label-selector docs-example=zipkin-tracing
- Gateway API
- APISIX CRD
apiVersion: v1
kind: Service
metadata:
  namespace: aic
  name: httpbin-external-domain
spec:
  type: ExternalName
  externalName: httpbin.org
---
apiVersion: apisix.apache.org/v1alpha1
kind: PluginConfig
metadata:
  namespace: aic
  name: zipkin-jaeger-plugin-config
spec:
  plugins:
    - name: zipkin
      config:
        endpoint: "http://jaeger.aic.svc.cluster.local:9411/api/v2/spans"
        sample_ratio: 1
---
apiVersion: gateway.networking.k8s.io/v1
kind: HTTPRoute
metadata:
  namespace: aic
  name: zipkin-jaeger-route
spec:
  parentRefs:
    - name: apisix
  hostnames:
    - "jaeger.example.com"
  rules:
    - matches:
        - path:
            type: PathPrefix
            value: /
      filters:
        - type: ExtensionRef
          extensionRef:
            group: apisix.apache.org
            kind: PluginConfig
            name: zipkin-jaeger-plugin-config
      backendRefs:
        - name: httpbin-external-domain
          port: 80
apiVersion: apisix.apache.org/v2
kind: ApisixUpstream
metadata:
  namespace: aic
  name: httpbin-external-domain
spec:
  ingressClassName: apisix
  externalNodes:
  - type: Domain
    name: httpbin.org
---
apiVersion: apisix.apache.org/v2
kind: ApisixRoute
metadata:
  namespace: aic
  name: zipkin-jaeger-route
spec:
  ingressClassName: apisix
  http:
    - name: zipkin-jaeger-route
      match:
        hosts:
          - "jaeger.example.com"
        paths:
          - /*
      upstreams:
      - name: httpbin-external-domain
      plugins:
      - name: zipkin
        enable: true
        config:
          endpoint: "http://jaeger.aic.svc.cluster.local:9411/api/v2/spans"
          sample_ratio: 1
Apply the configuration to your cluster:
kubectl apply -f zipkin-jaeger-ic.yaml
❶ Send spans to the built-in Zipkin v2 receiver in Jaeger. The Docker and Kubernetes examples use addresses that are reachable from the gateway.
❷ Trace every request for this example.
Send a request to the route:
- Admin API
- ADC
- Ingress Controller
curl "http://127.0.0.1:9080/anything/jaeger"
curl "http://127.0.0.1:9080/anything/jaeger"
curl "http://127.0.0.1:9080/anything" -H "Host: jaeger.example.com"
You should receive an HTTP/1.1 200 OK response.
For Kubernetes, make the Jaeger UI available locally in a separate terminal session:
kubectl port-forward -n aic service/jaeger 16686:16686
Wait until the asynchronously exported trace is available:
until curl -fsS \
  "http://127.0.0.1:16686/api/traces?service=APISIX&limit=10&lookback=1h" | \
  grep -q '"traceID"'; do
  sleep 1
done
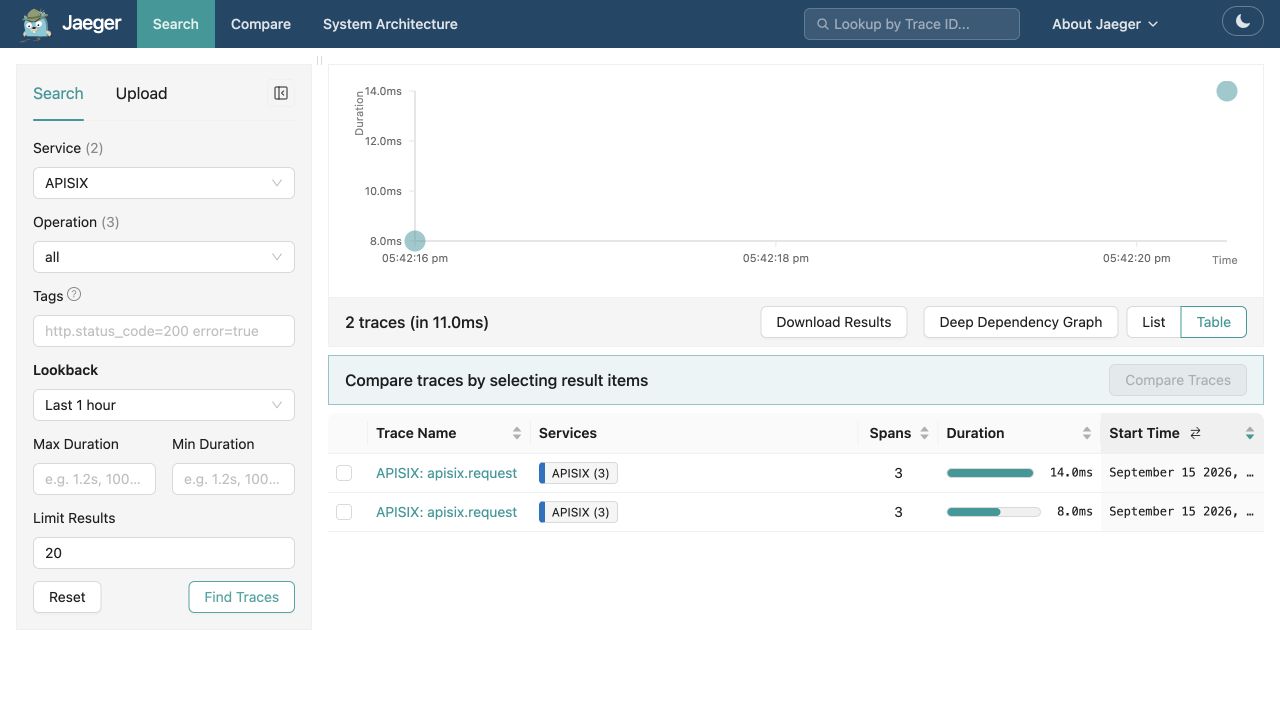
Navigate to the Jaeger web UI at http://127.0.0.1:16686, select APISIX as the service, and select Find Traces. You should see a trace corresponding to the request:
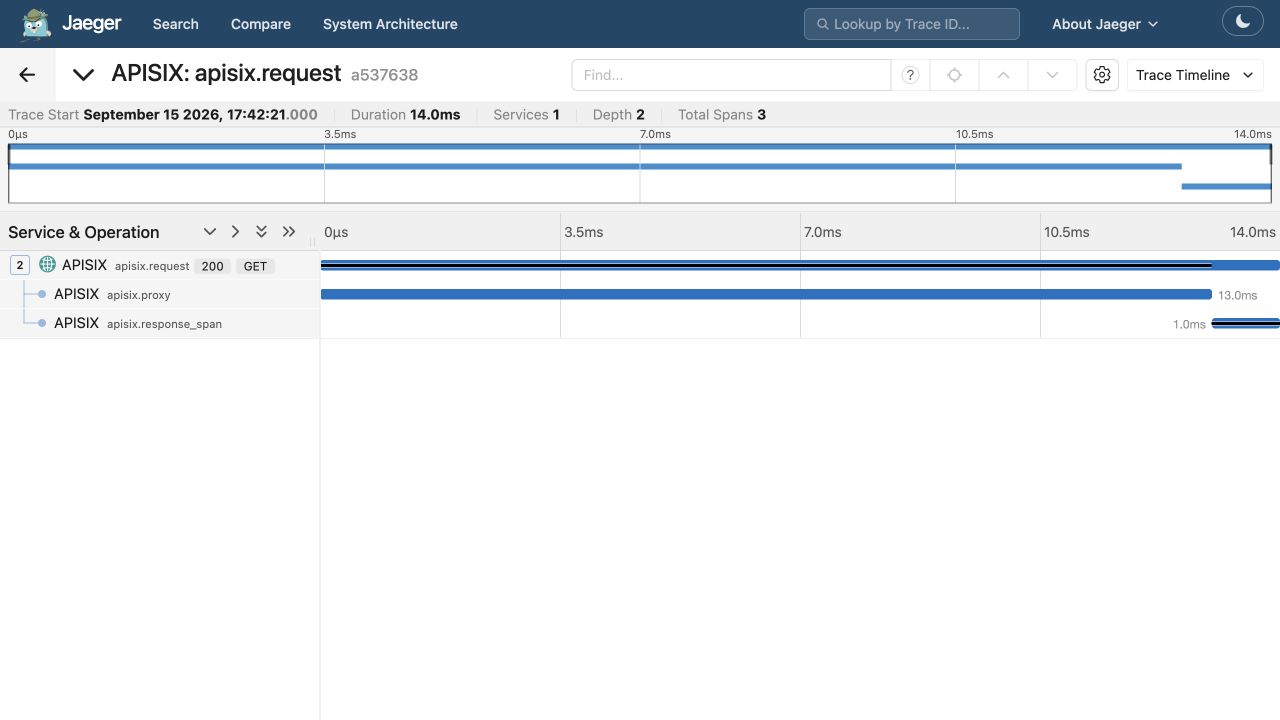
Open a trace to inspect its span hierarchy and timing:
Use Trace Variables in Logs
The following example continues with the Zipkin collector and /anything route configured in Send Traces to Zipkin.
The plugin can populate the following built-in variables for use in logger plugins and access logs:
zipkin_context_traceparent: W3Ctraceparentvalue generated from the request span contextzipkin_trace_id: trace ID of the request spanzipkin_span_id: span ID of the request span
Enable access log output for these variables and allow the plugin to set NGINX variables:
- Host or Docker
- Kubernetes (Helm)
Add or update this section in the gateway configuration file:
nginx_config:
  http:
    enable_access_log: true
    access_log_format: '{"time": "$time_iso8601","zipkin_context_traceparent": "$zipkin_context_traceparent","zipkin_trace_id": "$zipkin_trace_id","zipkin_span_id": "$zipkin_span_id","remote_addr": "$remote_addr"}'
    access_log_format_escape: json
plugin_attr:
  zipkin:
    set_ngx_var: true
❶ access_log_format: include the zipkin plugin variables in the access log.
❷ set_ngx_var: populate the zipkin NGINX variables.
Reload the gateway for configuration changes to take effect.
For Helm deployments, update the values that render the access log format and plugin_attr.zipkin. Keep the rest of your values file unchanged.
For the APISIX Helm chart, set the following values:
apisix:
  nginx:
    logs:
      enableAccessLog: true
      accessLogFormat: '{"time": "$time_iso8601","zipkin_context_traceparent": "$zipkin_context_traceparent","zipkin_trace_id": "$zipkin_trace_id","zipkin_span_id": "$zipkin_span_id","remote_addr": "$remote_addr"}'
      accessLogFormatEscape: json
  pluginAttrs:
    zipkin:
      set_ngx_var: true
For the API7 Gateway Helm chart, set the following values:
logs:
  enableAccessLog: true
  accessLogFormat: '{"time": "$time_iso8601","zipkin_context_traceparent": "$zipkin_context_traceparent","zipkin_trace_id": "$zipkin_trace_id","zipkin_span_id": "$zipkin_span_id","remote_addr": "$remote_addr"}'
  accessLogFormatEscape: json
pluginAttrs:
  zipkin:
    set_ngx_var: true
Then apply the values file with the chart used for this gateway release. Replace <chart-version> with the version used by the installed release:
helm upgrade <release-name> <chart-name> \
  --version <chart-version> \
  -n <namespace> \
  -f values.yaml
Send a request through the traced route:
curl "http://127.0.0.1:9080/anything"
You should see an access log entry similar to the following:
{"time": "2026-09-15T16:25:58+00:00","zipkin_context_traceparent": "00-7931097725ec577a17fe02a5c067a440-66ae231b61fef3ef-01","zipkin_trace_id": "7931097725ec577a17fe02a5c067a440","zipkin_span_id": "66ae231b61fef3ef","remote_addr": "192.168.158.1"}