Docker Installation
This guide will walk you through the rapid deployment of all essential components of API7 Enterprise on a single machine for PoC feature verification. Once the deployment is complete, the address of this machine will serve as the API7 Gateway address.
For production use, high availability is essential, so all components should be deployed in a cluster configuration rather than on a single machine. Please contact us for production environment deployment support.
Prerequisites
- Install Docker and use version 20.10.7 or later.
- Operating system CentOS uses version 7.6 or later.
- Use an instance with a minimum of 2 cores and 4GB of memory.
- Make sure the following Open Ports have been added to the security group or firewall allow list:
| Component | Listen Ports | Open Ports |
|---|---|---|
| api7-dashboard | 9000 | 9000 |
| etcd | 2379,2380 | 2379 |
| api7-gateway | 80,443,9091,9092 | 80,443 |
| opensearch | 9200 | - |
| confd | - | - |
| prometheus | 9090 | 9090 |
| alertmanager | 9093 | 9093 |
| grafana | 3000 | 3000 |
Create Network
docker network create api7-ee
Get Docker Image
docker pull api7/api7-ee:2.13.2304
Install API7 Enterprise in Quickstart Mode
curl download.apiseven.com/api7-ee/quickstart@2.13.2304 | sudo bash
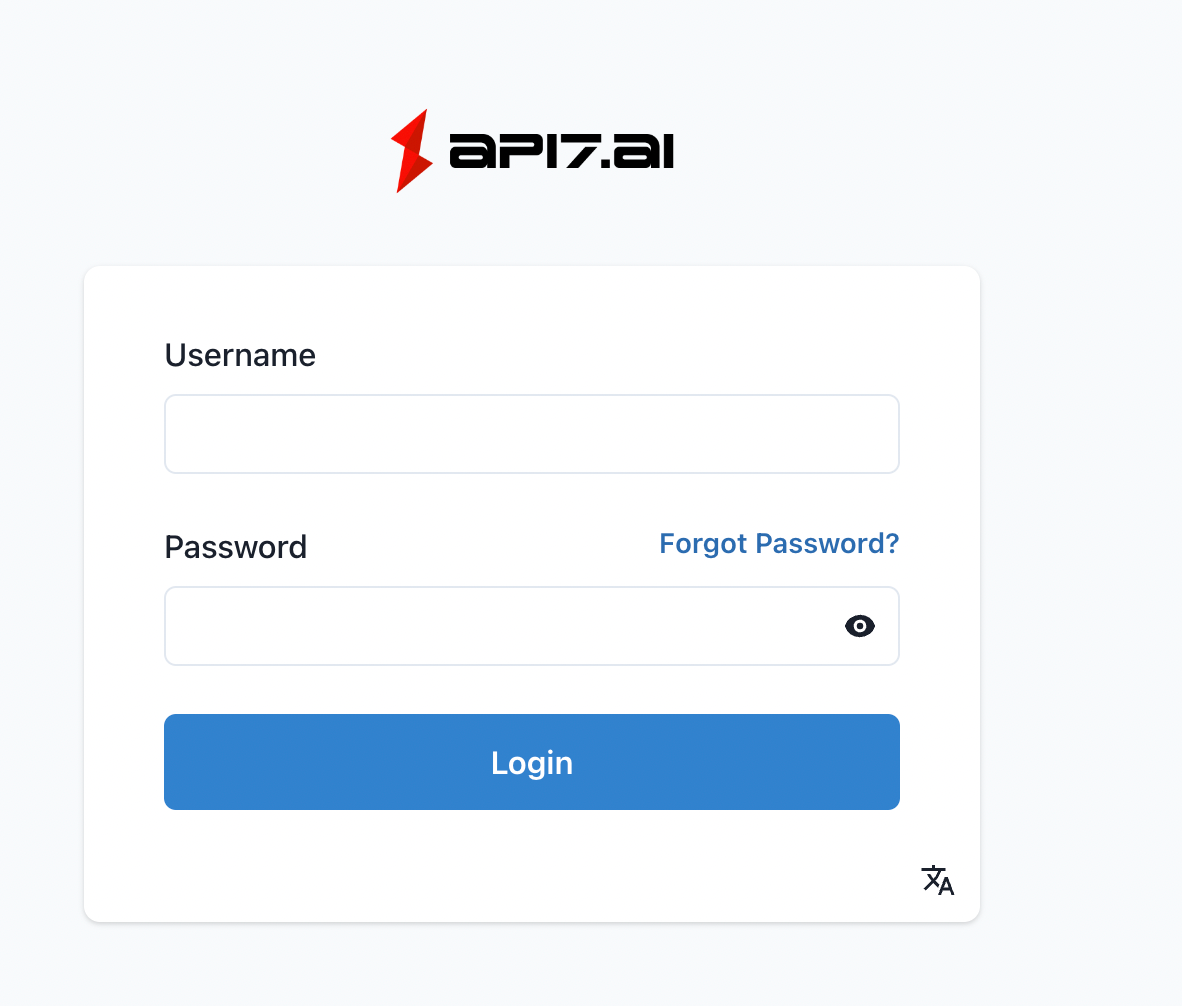
Login to API7 Enterprise Dashboard
Navigate to http://<API7_GATEWAY_ADDRESS>:9000 and login to API7 Enterprise Dashboard.Default username and password are both admin.
During the installation, the first cluster poc, the first etcd resource default, and the first gateway node (data plane node) will be automatically created.
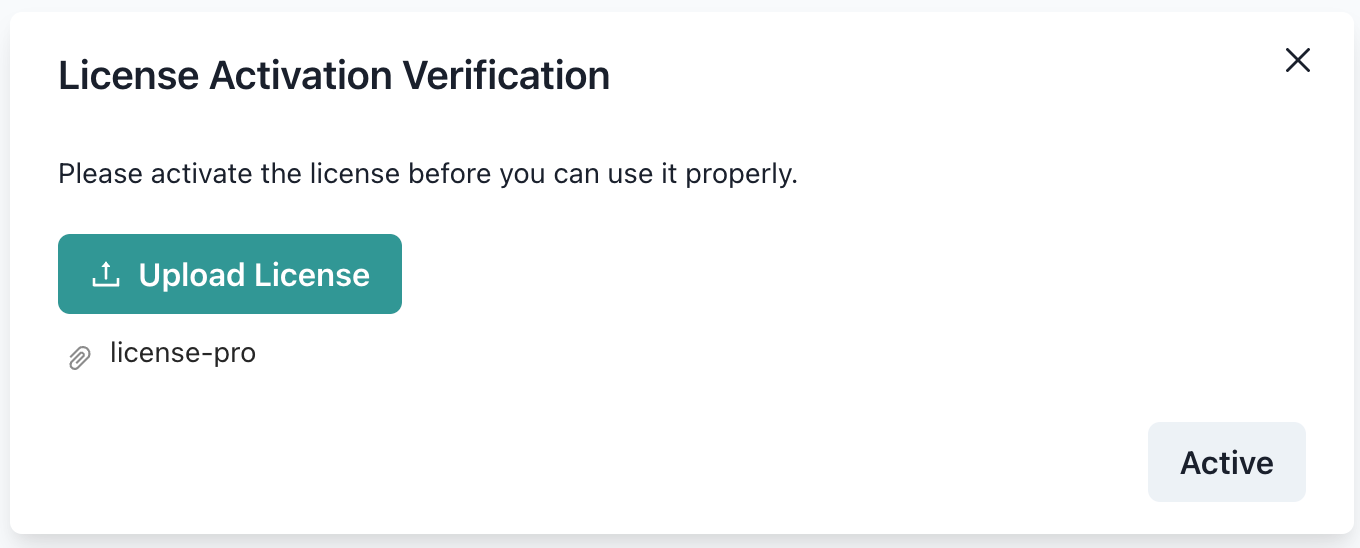
Activate License
Refer to the documentation on Get License,then upload and activate the license.
Start Control Plane Dependencies
Control Plane dependencies refer to the following components:
- OpenSearch 1.3.7
- Grafana 7.3.7
- Prometheus 2.25.0
- confd 0.16.0
- AlertManager 0.22.2
Start confd
echo 'backend = "etcdv3"
confdir = "/etc/confd"
nodes = [
  "http://api7-ee:2379",
]
watch = true' > ./confd.toml
docker run -d --network=api7-ee --name confd \
  -v $(pwd)/confd.toml:/etc/confd/confd.toml \
  -v $(pwd)/prometheus_conf:/root/prometheus \
  -v $(pwd)/alertmanager_conf:/root/alertmanager  \
  api7/api7-confd:0.16.0
Check the status of the container to ensure it is Up:
docker ps | grep confd
Start Prometheus
docker run -d --name prometheus --network api7-ee \
  -p 9090:9090 \
  -v $(pwd)/prometheus_conf:/etc/prometheus \
  --hostname prometheus \
  --restart always prom/prometheus:latest \
  --config.file=/etc/prometheus/prometheus.yml --web.enable-lifecycle
Check the status of the container to ensure it is Up:
docker ps | grep prometheus
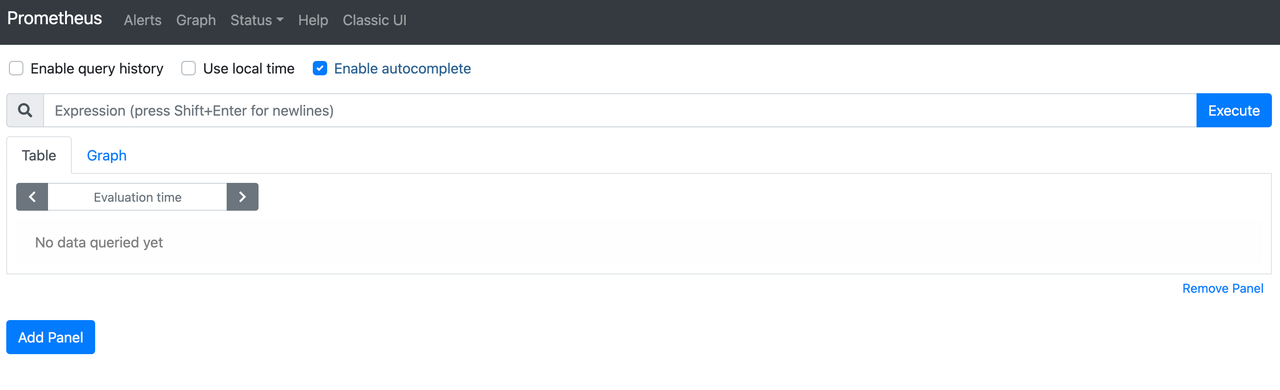
Navigate to http://<API7_GATEWAY_ADDRESS>:9090 and check Prometheus Console.
Start AlertManager
docker run -d --name alertmanager --network=api7-ee \
  -p 9093:9093 \
  -v $(pwd)/alertmanager_conf:/etc/alertmanager \
  --restart always prom/alertmanager:latest \
  --log.level=debug --config.file=/etc/alertmanager/alertmanager.yml
Check the status of the container to ensure it is Up:
docker ps | grep alertmanager
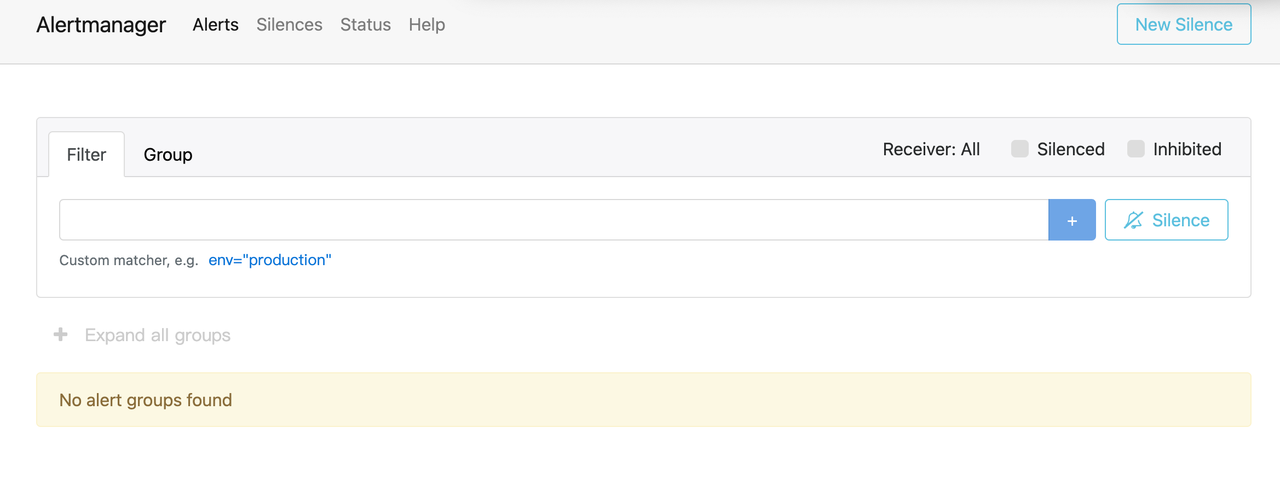
Navigate to http://<API7_GATEWAY_ADDRESS>:9093/#/alerts and check AlertManager Console.
Start OpenSearch
docker run -d --name opensearch --network api7-ee \
  -p 9200:9200 \
  --hostname opensearch \
  --restart always \
  --env discovery.type=single-node \
  --env plugins.security.disabled=true \
  --env cluster.routing.allocation.disk.threshold_enabled=true \
  --env ES_JAVA_OPTS="-Xmx4g -Xms4g" \
  opensearchproject/opensearch:2.3.0
Check the status of the container to ensure it is Up:
docker ps | grep opensearch
Test OpenSearch:
curl http://localhost:9200 -v
Get response:
< HTTP/1.1 200 OK
< content-type: application/json; charset=UTF-8
< content-length: 567
<
{
  "name" : "node-1",
  "cluster_name" : "opensearch-cluster",
  "cluster_uuid" : "PrNDIhRuSOamdu-fs0WfKw",
  "version" : {
    "distribution" : "opensearch",
    "number" : "1.3.7",
    "build_type" : "tar",
    "build_hash" : "db18a0d5a08b669fb900c00d81462e221f4438ee",
    "build_date" : "2022-12-07T22:59:20.186520Z",
    "build_snapshot" : false,
    "lucene_version" : "8.10.1",
    "minimum_wire_compatibility_version" : "6.8.0",
    "minimum_index_compatibility_version" : "6.0.0-beta1"
  },
  "tagline" : "The OpenSearch Project: https://opensearch.org/"
}
Start Grafana
mkdir grafana_conf

echo "[security]
allow_embedding = true" > ./grafana_conf/grafana.ini
docker run -d --name grafana --network api7-ee \
  -p 3000:3000 \
  -v $(pwd)/grafana_conf/grafana.ini:/etc/grafana/grafana.ini \
  --hostname grafana \
  --restart always \
  grafana/grafana:7.3.7
Check the status of the container to ensure it is Up:
docker ps | grep grafana
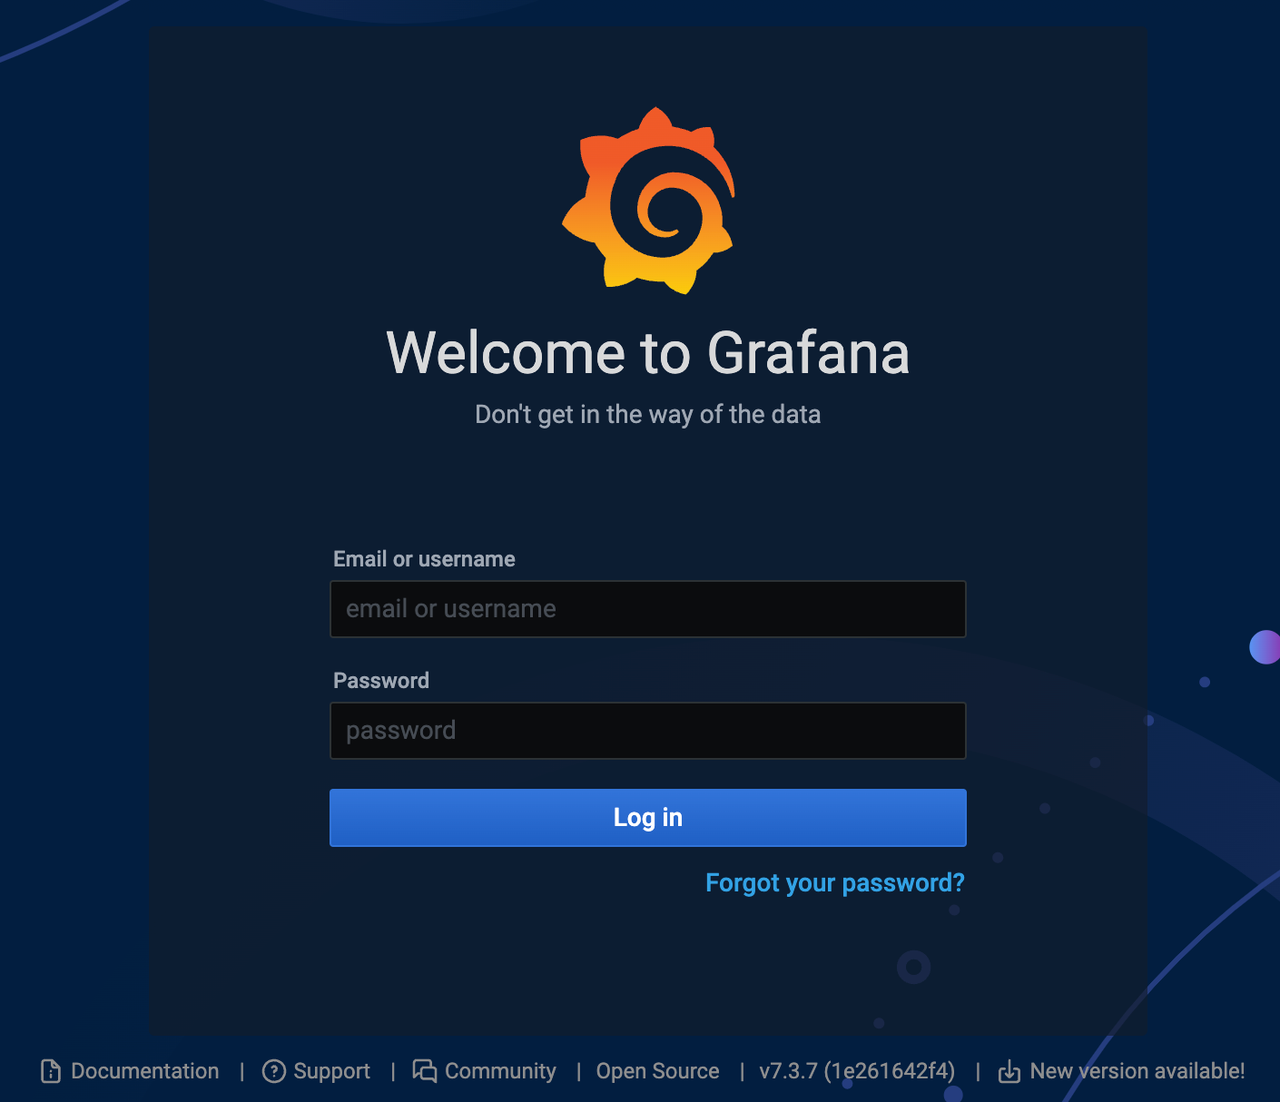
Navigate to http://<API7_GATEWAY_ADDRESS>:3000 and loginto Grafana Console.Default username and password are both admin.
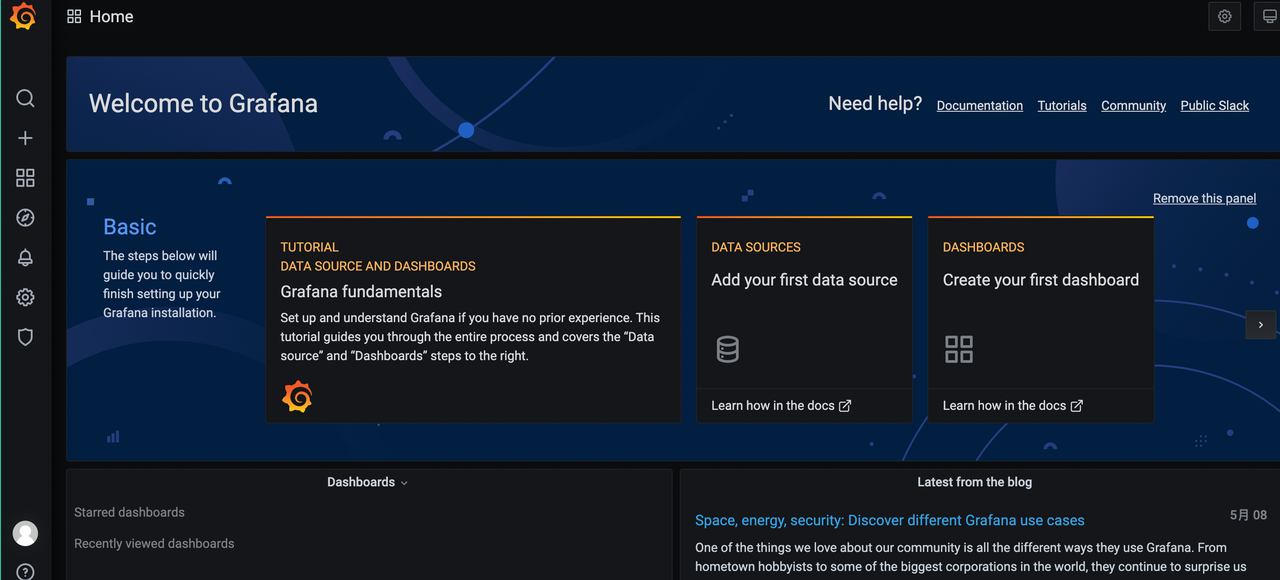
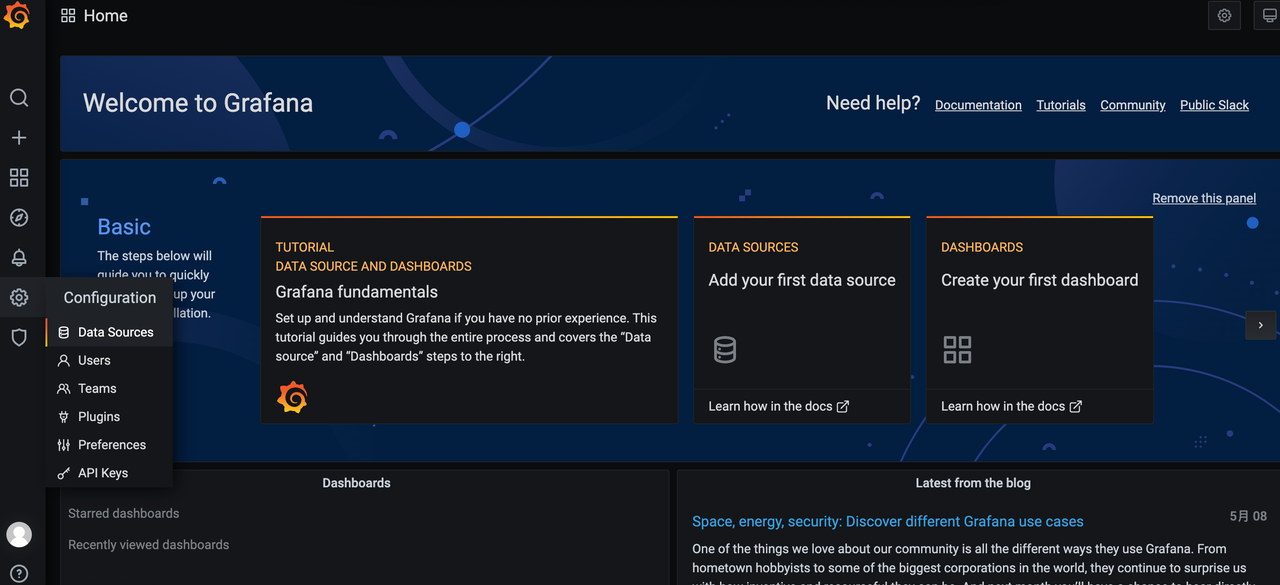
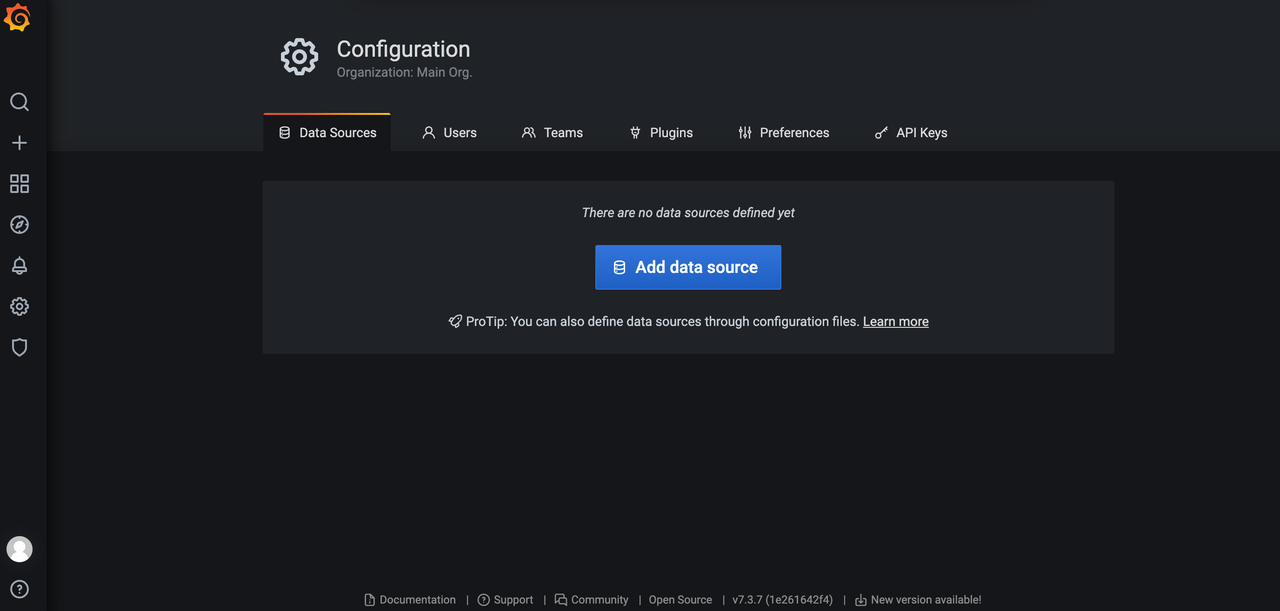
Configure Grafana
On the left menu,select Configuration > Data Sources:
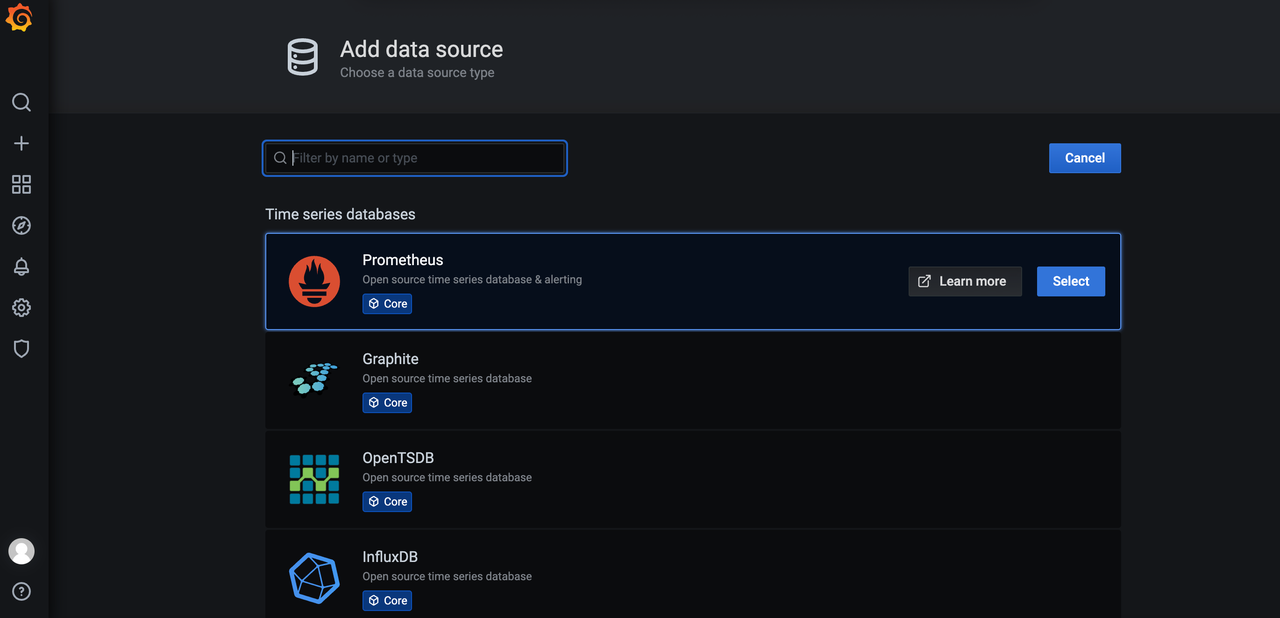
Click Add data source:
Select Prometheus:
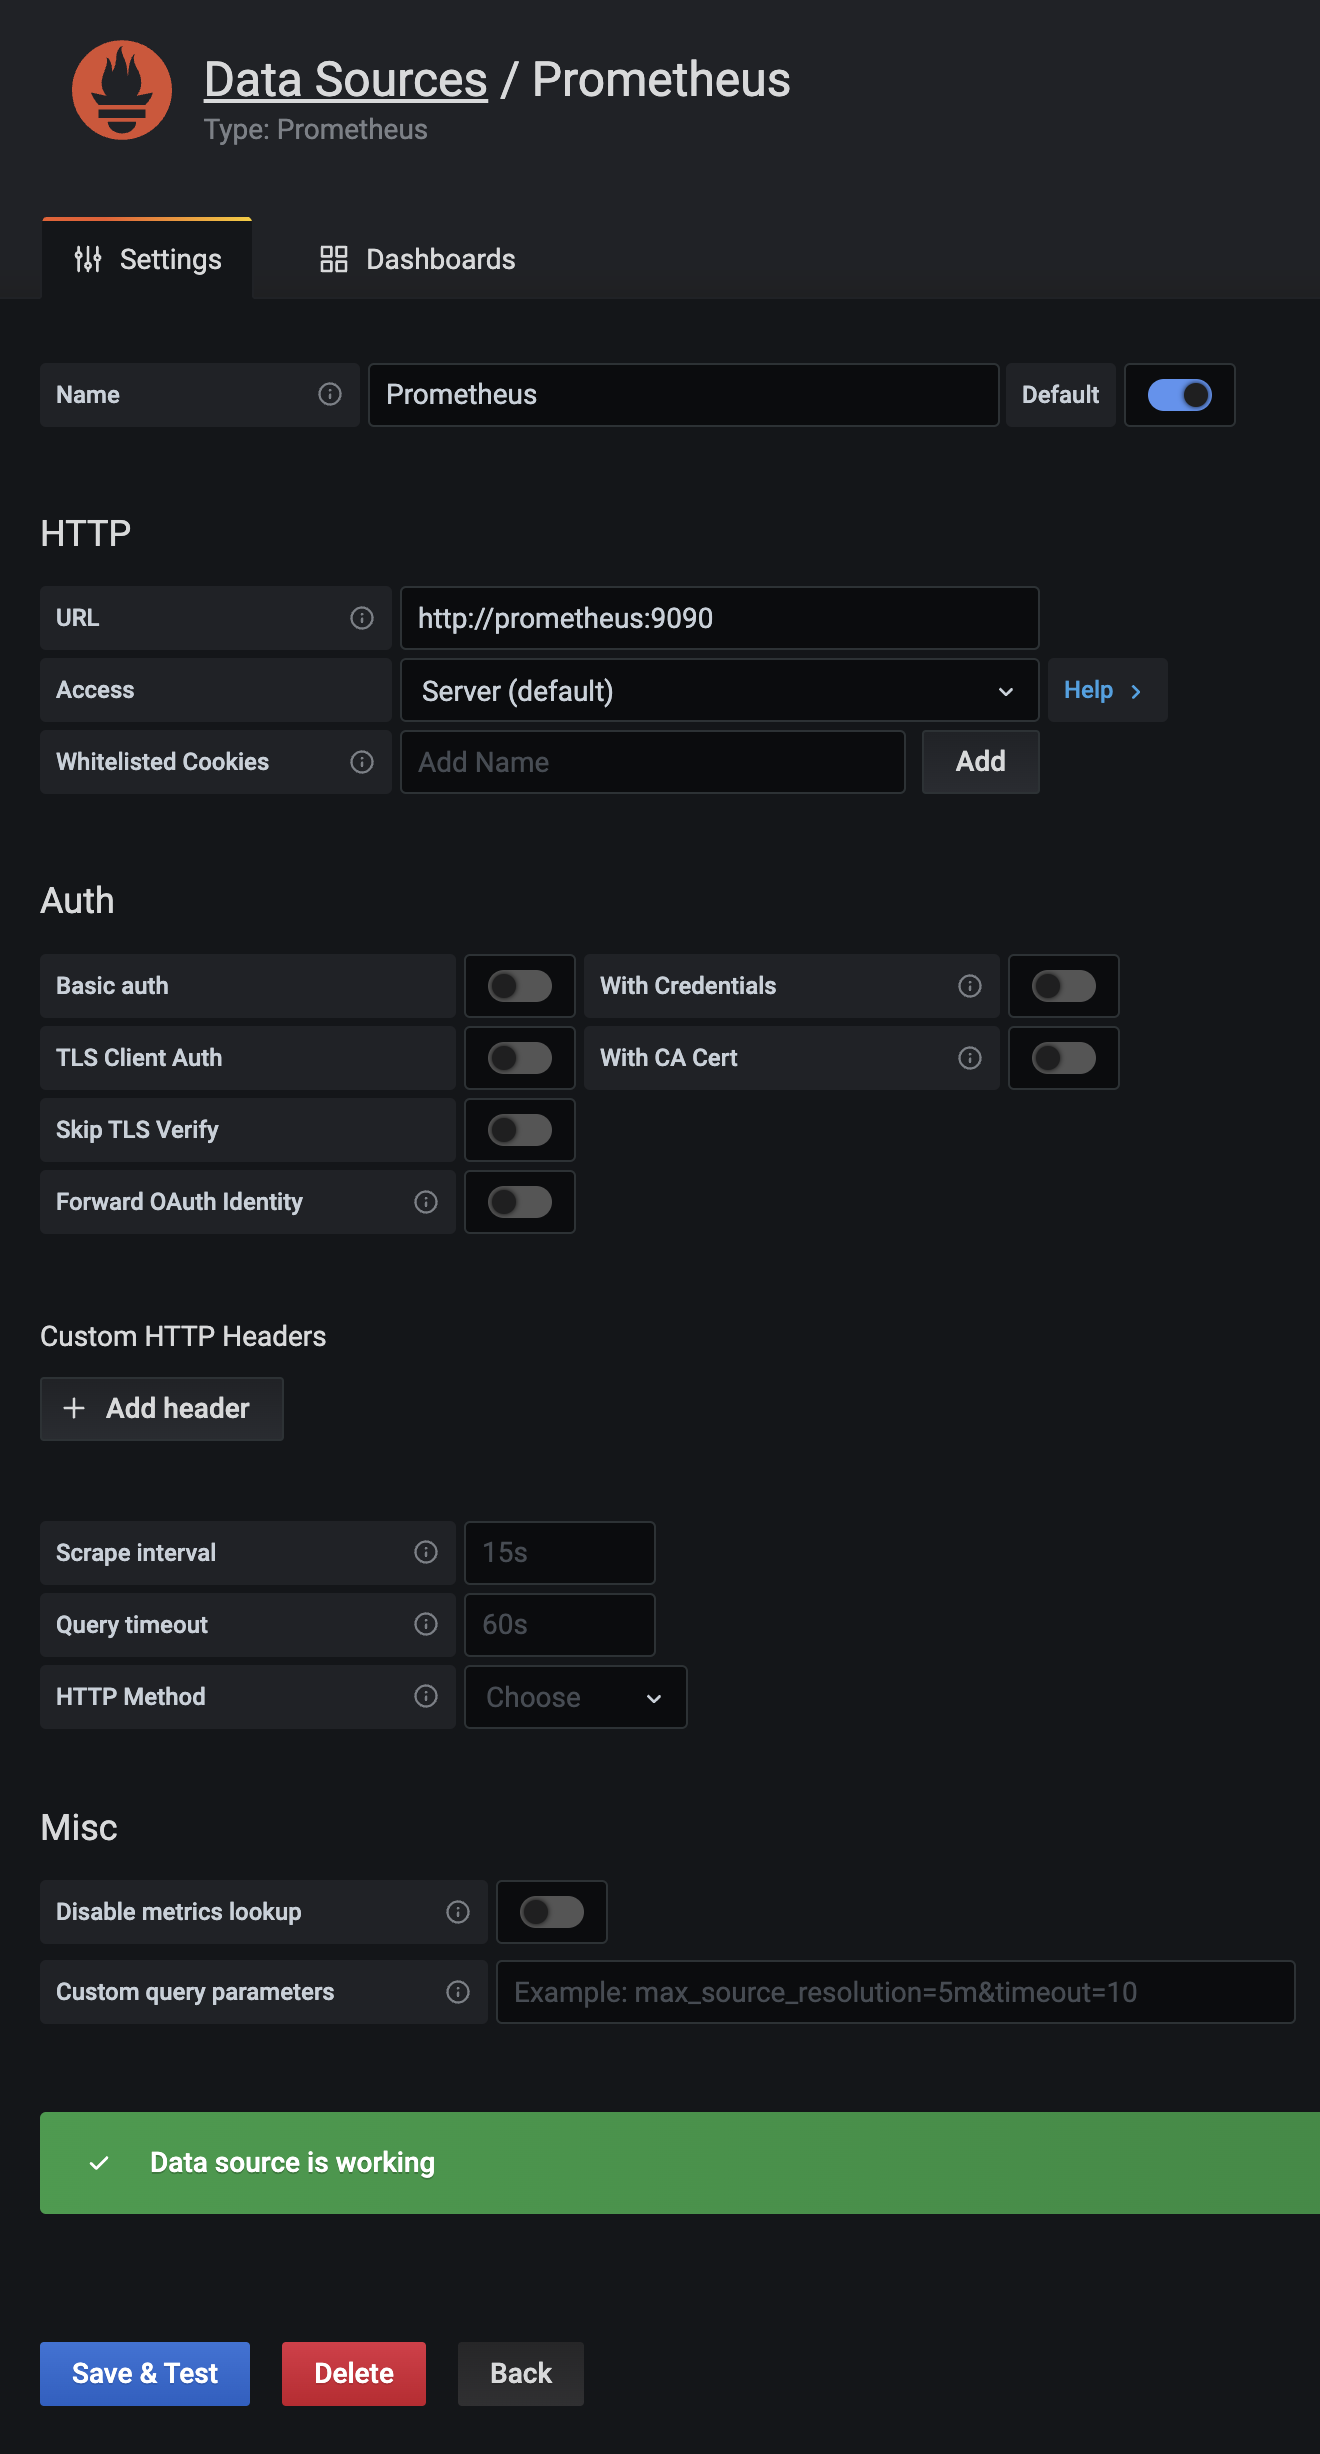
Modify HTTP > URL to Prometheus address http://prometheus:9090 then click Save & Test.
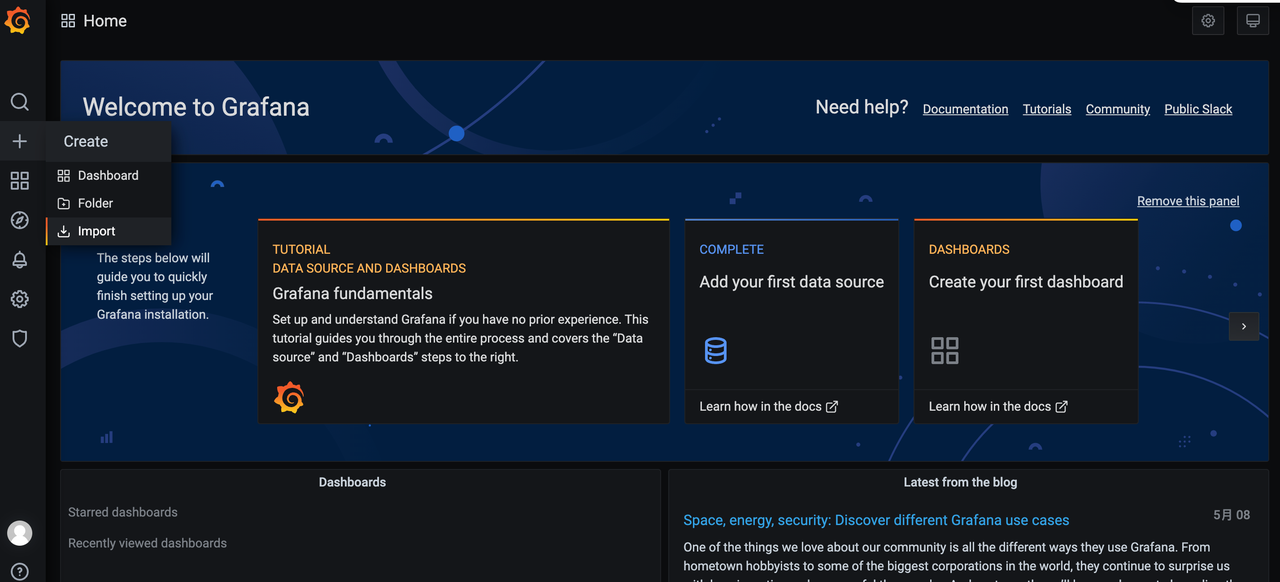
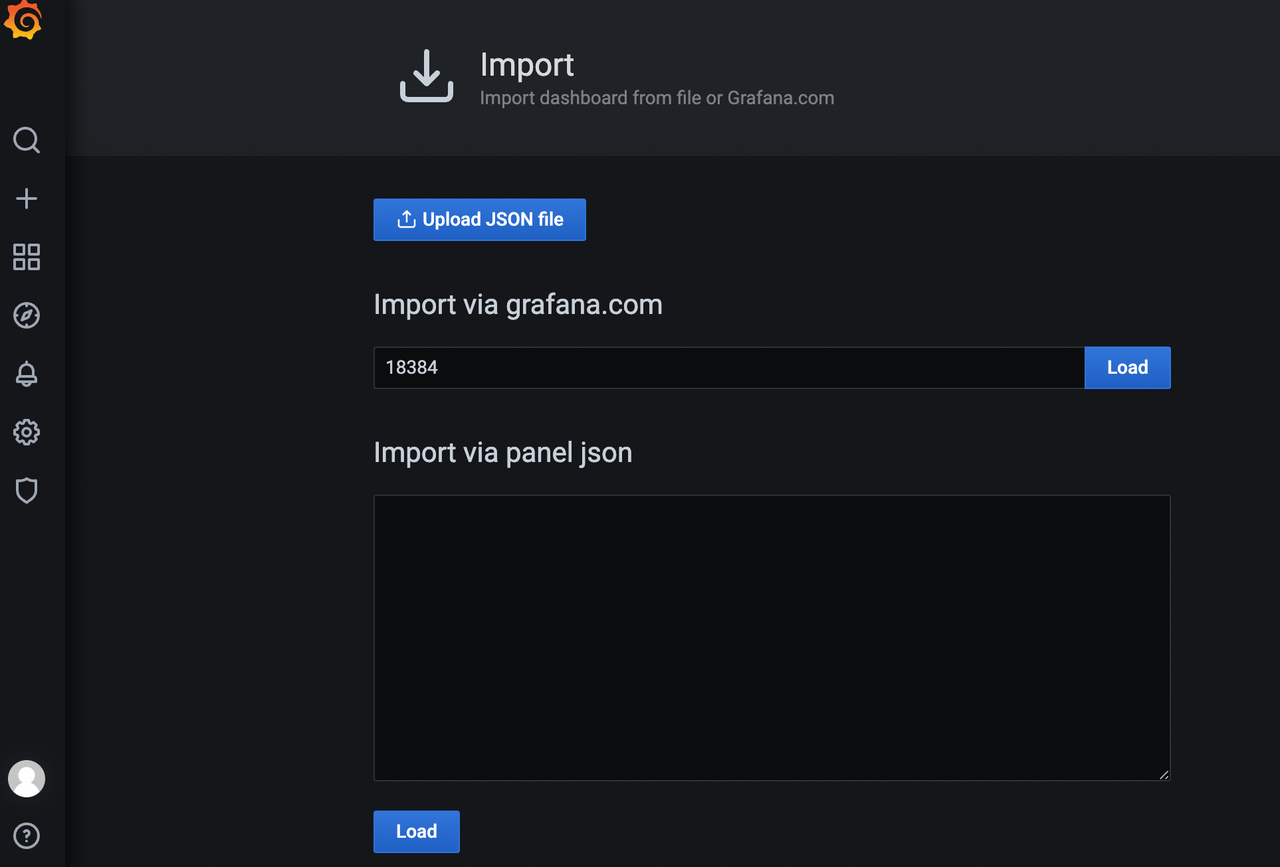
on the left menu, select Create > Import:
Eneter 18384 as Grafana.com dashboard id, then click the Load button on the right:
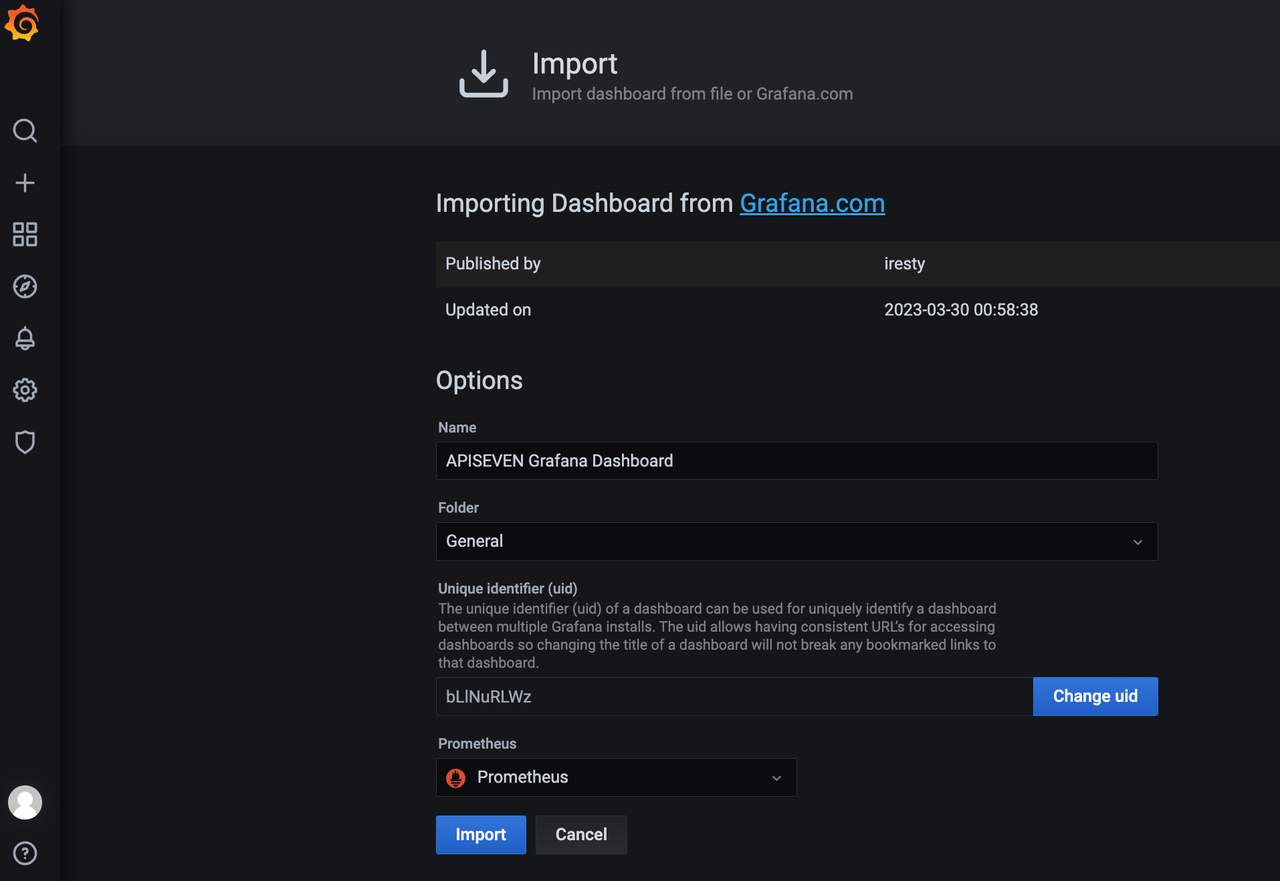
Confirm the "APISEVEN Grafana Dashboard" details, select Prometheus data source, then click Import:
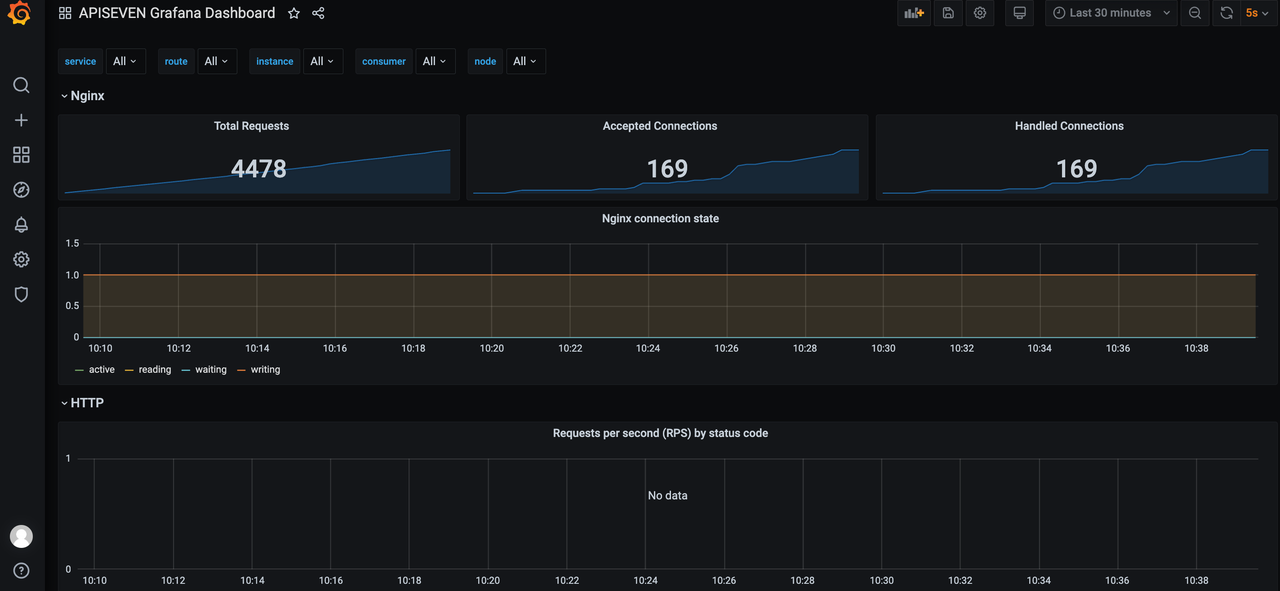
Preview Grafana dashboard:
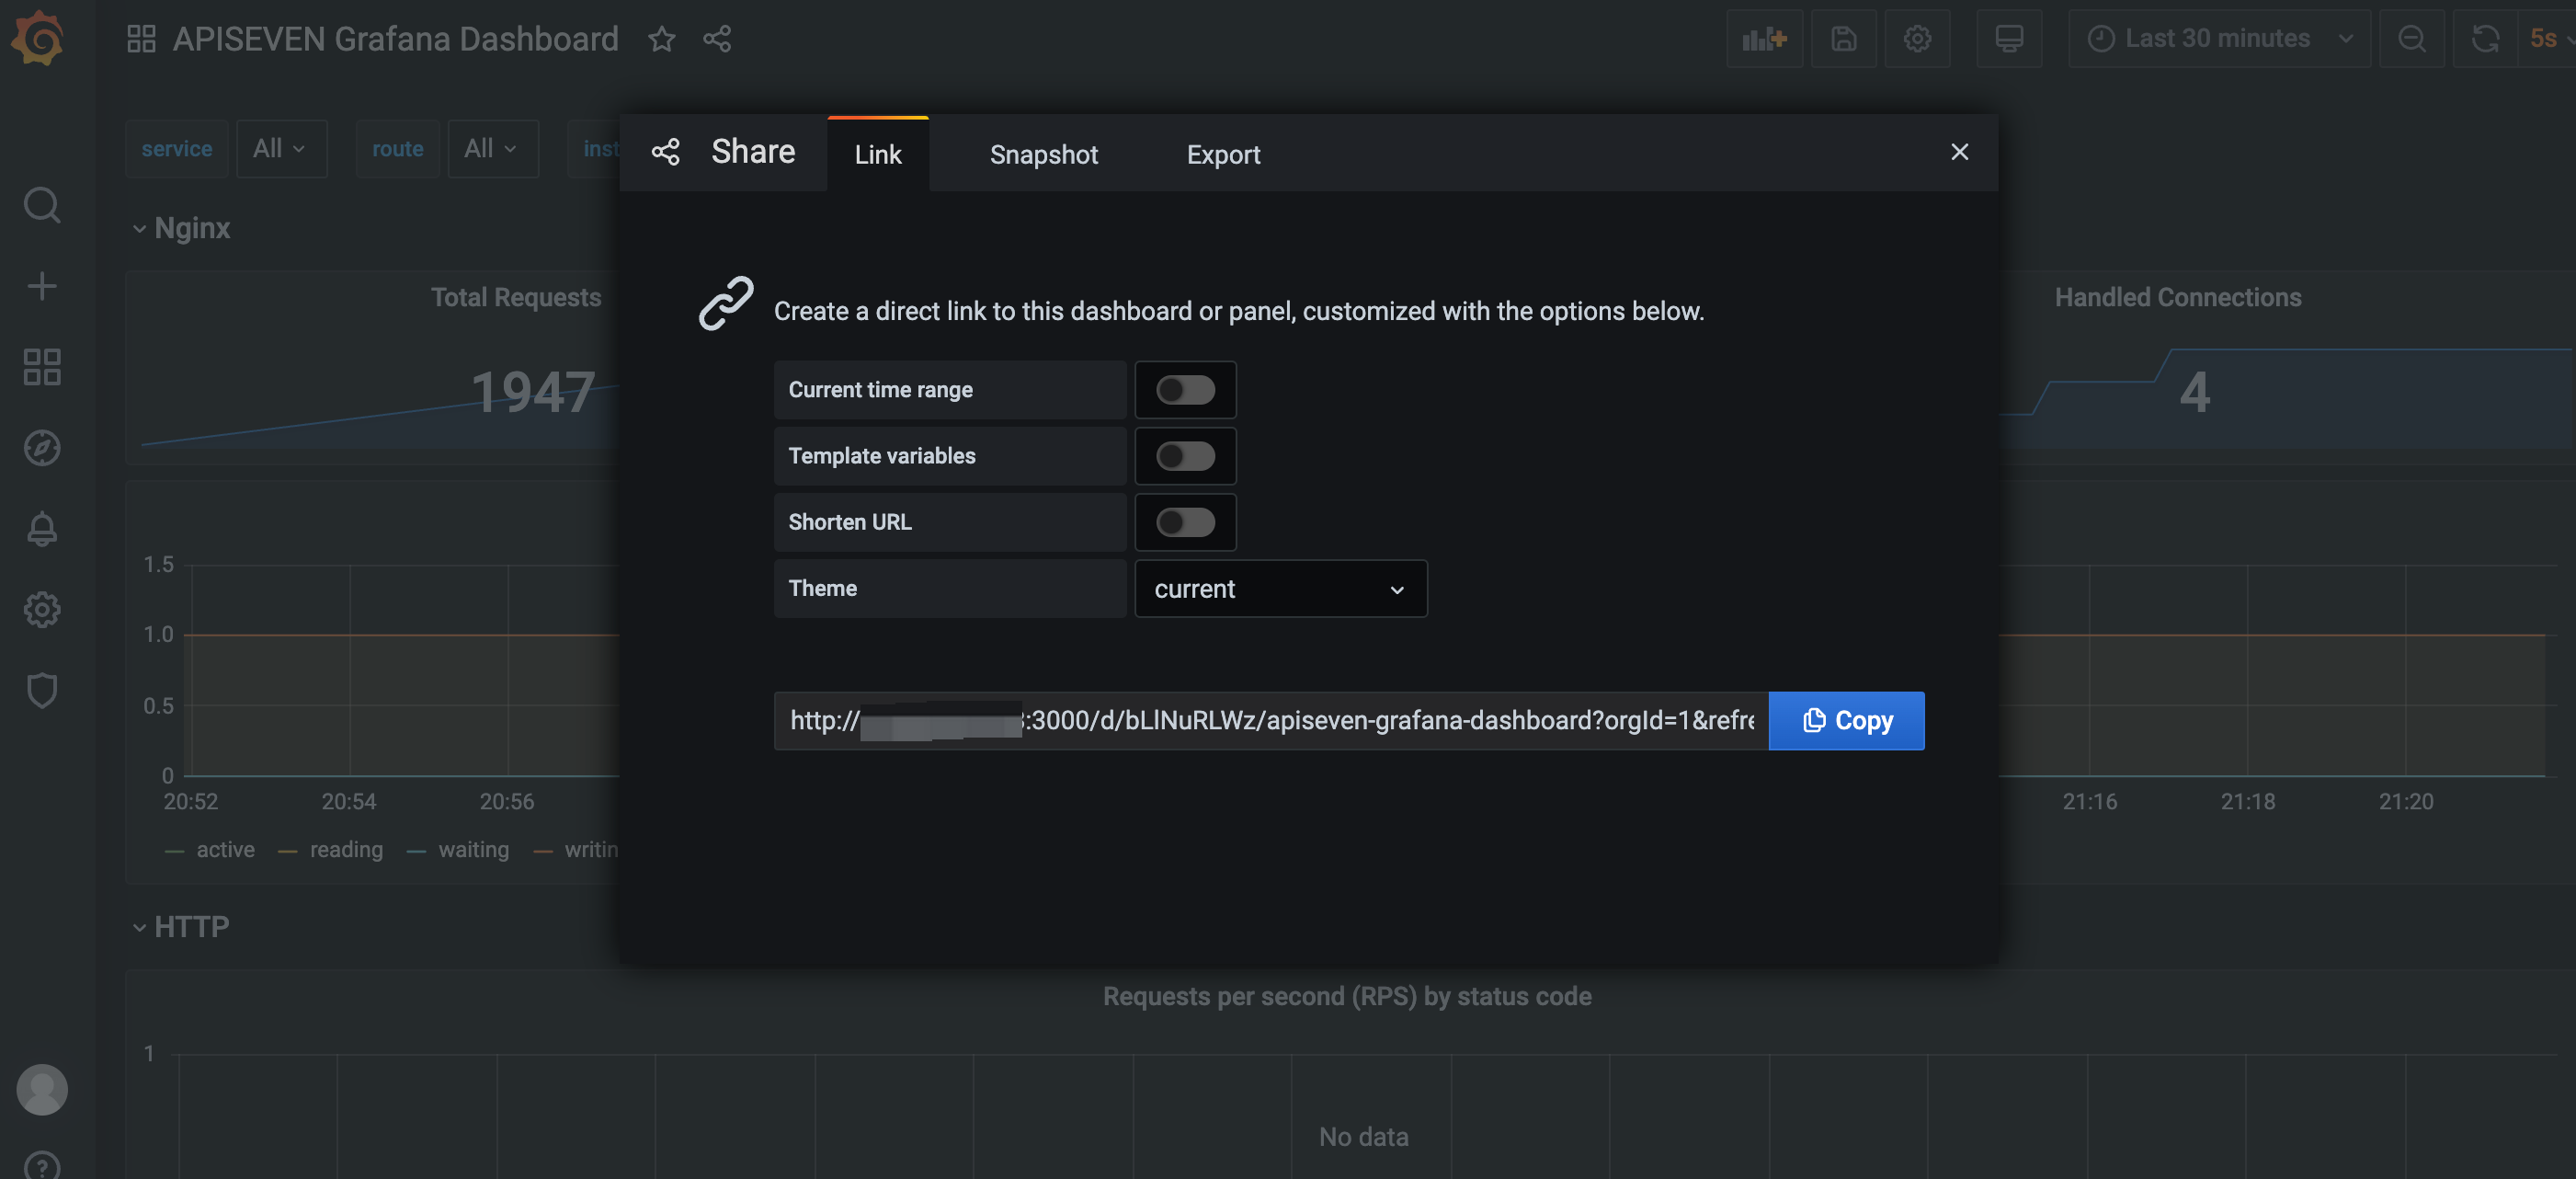
Click the Share icon, turn off all switches, then click Copy to get Grafana dashboard URL:
API7 Enterprise System Settings
- Access the API7 Enterprise dashboard, select System Management in the top menu, and then choose Settings in the left menu. Go to the Grafana URL tab. Fill in the copied Grafana dashboard address from the previous step and click Save.
- Switch to the Prometheus tab and enter
http://prometheus:9090in theHostsfield. Click Save. - Switch to the OpenSearch tab and enter
http://opensearch:9200in theHostsfield. Click Save.
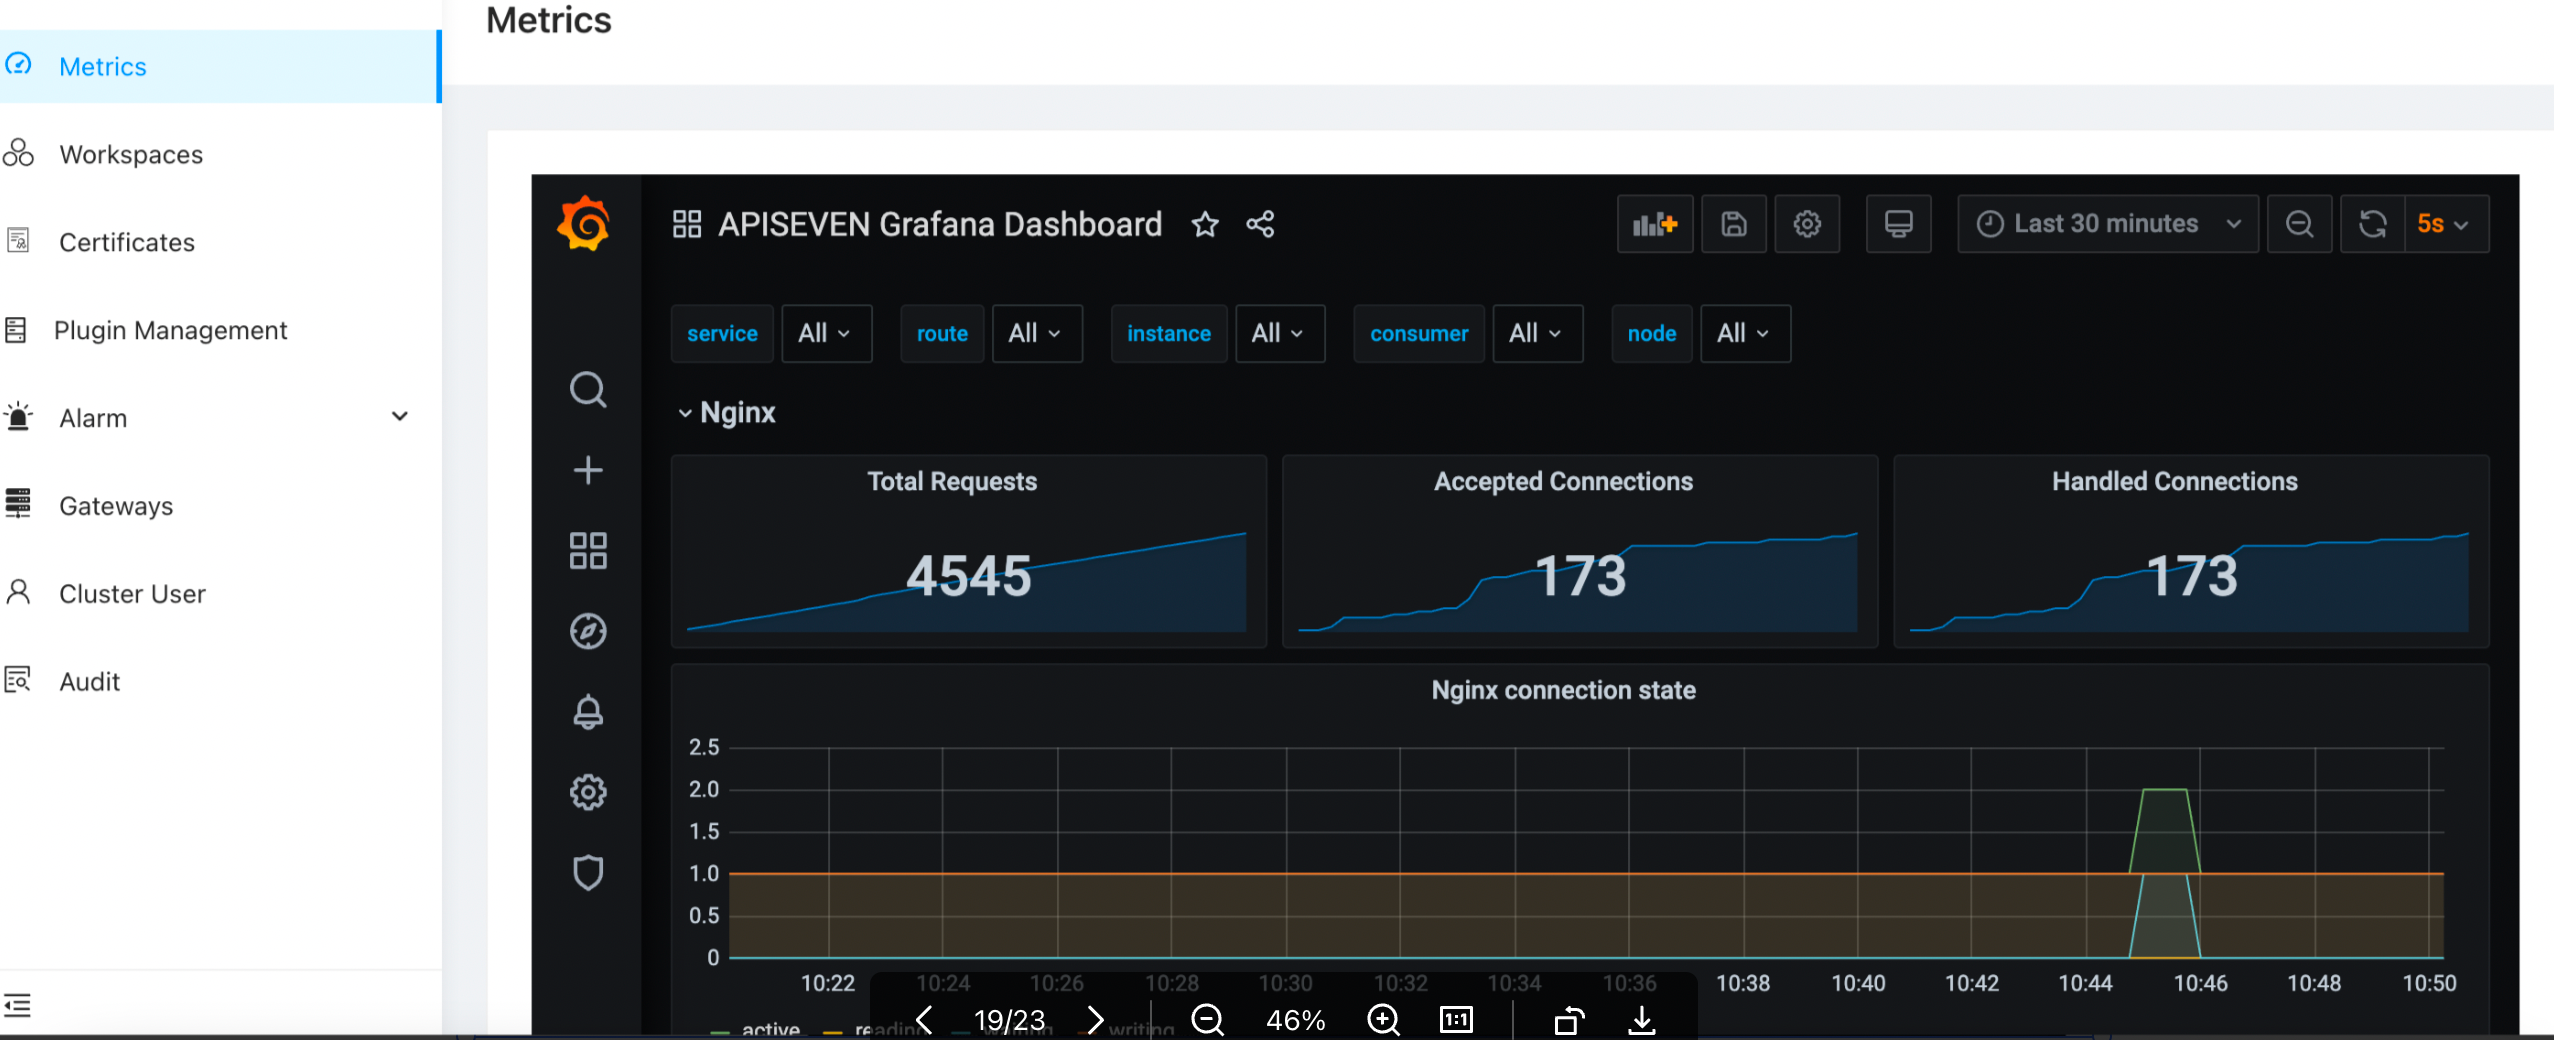
Validate Metrics
Navigate to the poc cluster and select Metrics from the left menu. The embedded Grafana dashboard will be displayed here:
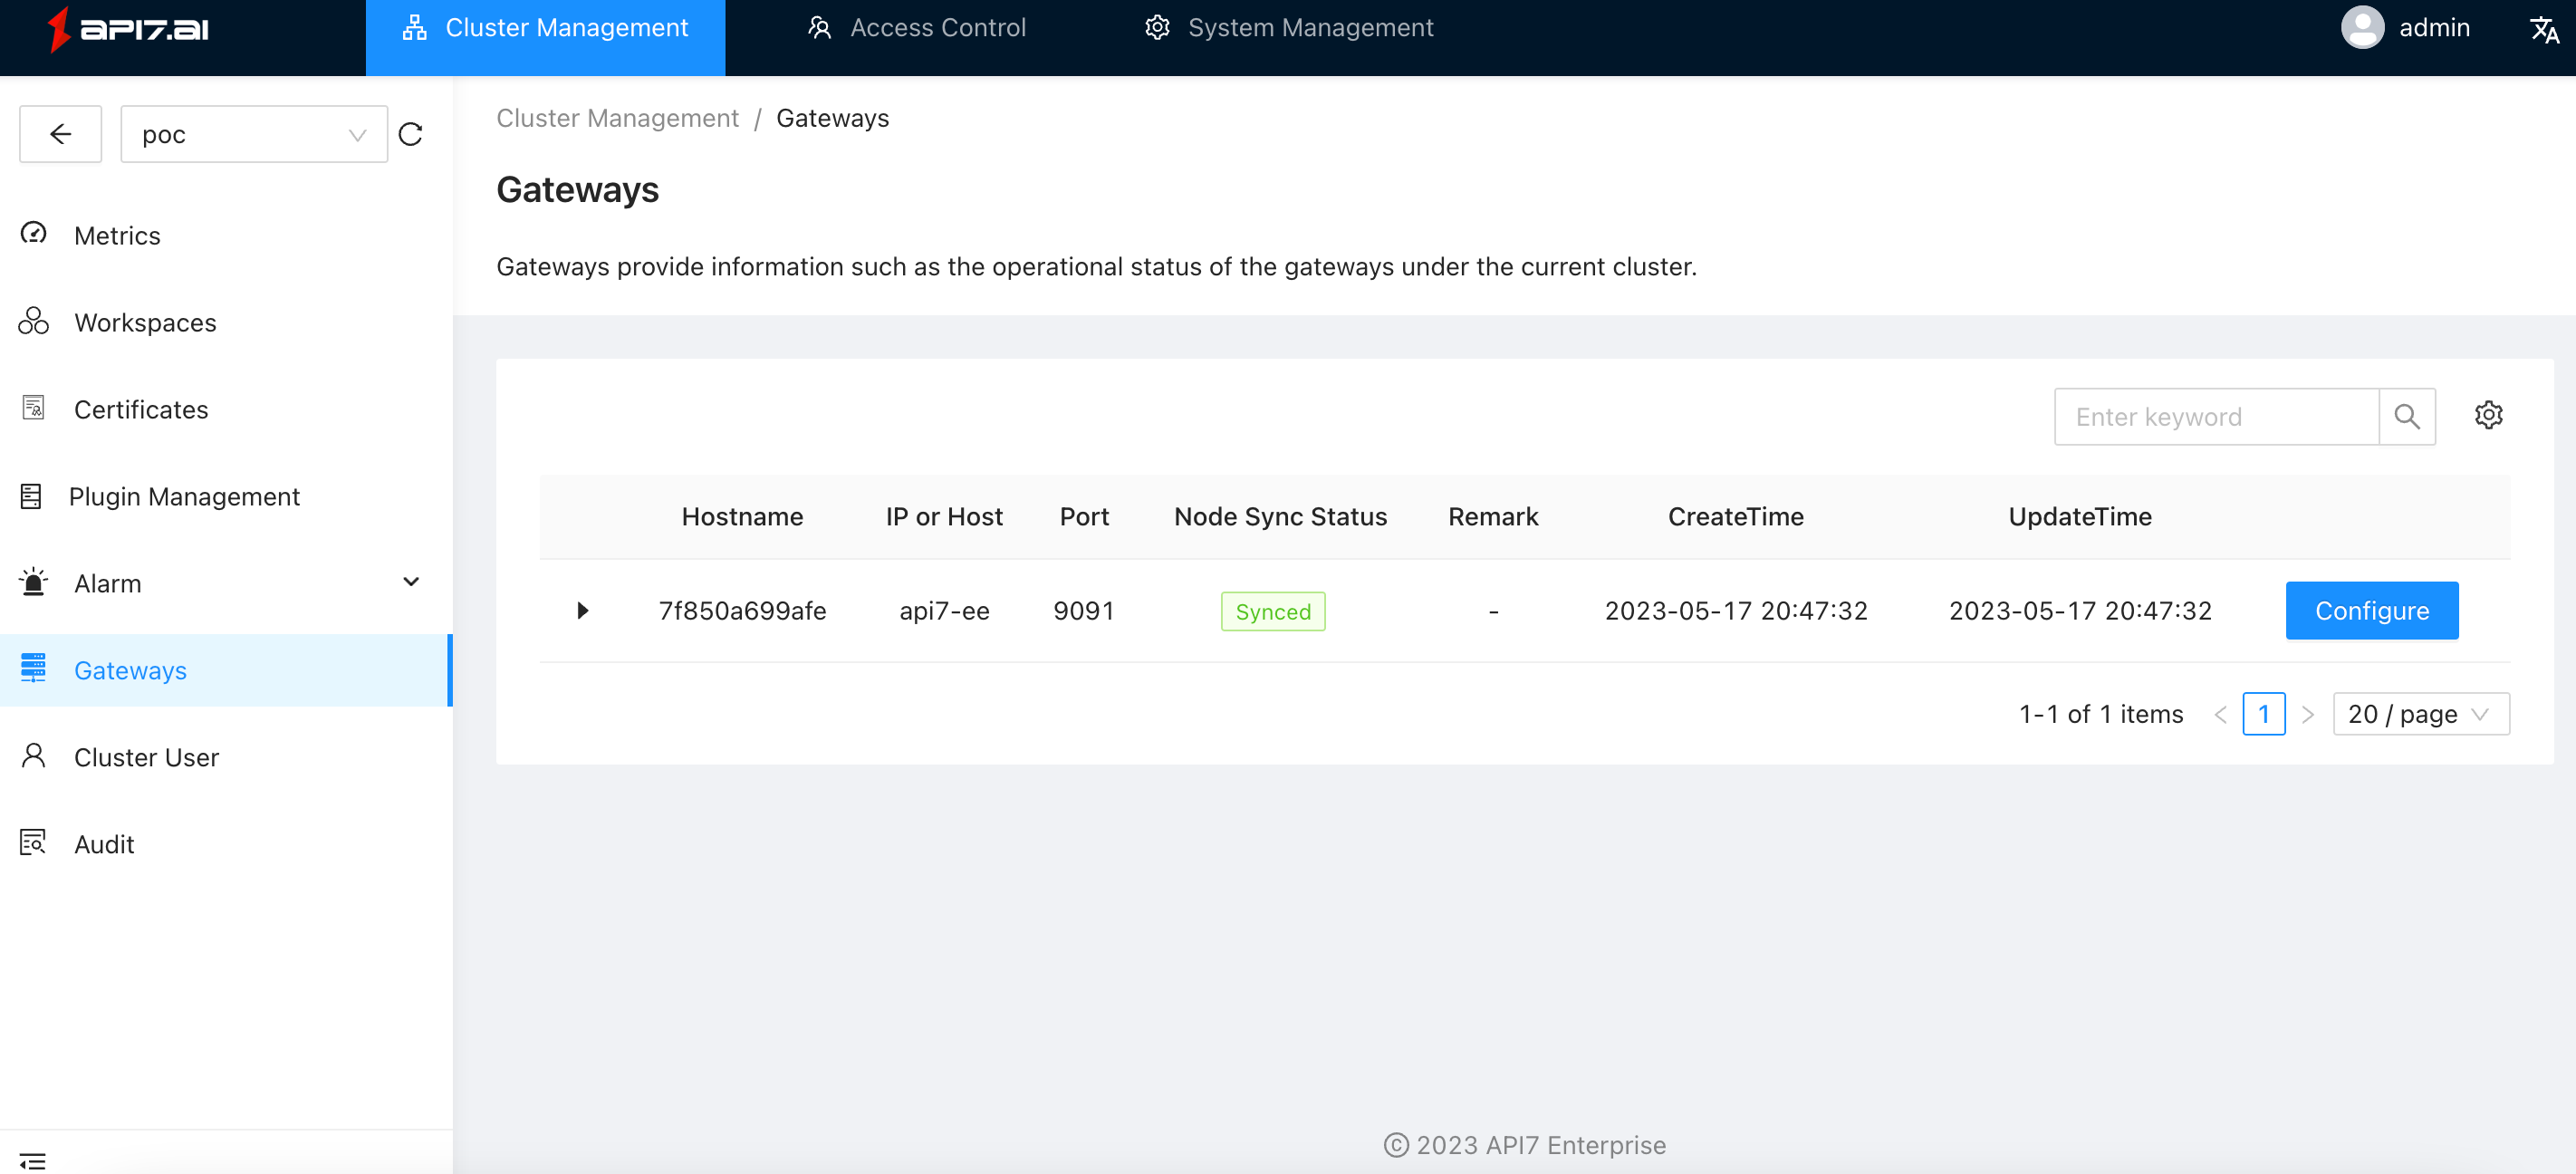
Validate Gateway Nodes
Navigate to the poc cluster and select Gateway Nodes from the left menu. Confirm that there is one node and its status is Synced.