Collect Data Plane Access and Error Logs with Grafana Loki
Grafana Loki is an open-source logging and monitoring system developed by Grafana Labs. It is designed to handle large volumes of log data and provides a highly scalable and efficient solution for log aggregation, storage, and analysis. With Loki, users can centralize logs from various sources, monitor and analyze log data in real-time, and gain insights into system behavior, performance, and troubleshooting.
This guide provides a step-by-step tutorial on integrating API7 Enterprise with Loki to collect access logs and error logs from the data plane. It will also demonstrate how to visualize this data on the Grafana dashboard.
Prerequisites
- Install API7 Enterprise.
- Use
Grafana Lokiversion 2.8.2 or higher. - Install
unzip:
yum install wget unzip -y
Get Loki
Use Grafana Loki as data source for Grafana.
Install Promtail
Promtail is a component of the Grafana Loki logging system, responsible for collecting log data from various sources and forwarding it to the Loki backend for storage and analysis.
curl -O -L "https://github.com/grafana/loki/releases/download/v2.8.2/promtail-linux-amd64.zip"
unzip "promtail-linux-amd64.zip"
chmod a+x "promtail-linux-amd64"
Configure Promtail
Get promtail-local-config.yaml:
wget https://raw.githubusercontent.com/grafana/loki/main/clients/cmd/promtail/promtail-local-config.yaml
Edit the promtail-local-config.yaml file to add new job.
vim promtail-local-config.yaml

server:
  http_listen_port: 9080
  grpc_listen_port: 0

positions:
  filename: /tmp/positions.yaml

clients:
  - url: http://localhost:3100/loki/api/v1/push

scrape_configs:
- job_name: system
  static_configs:
  - targets:
      - localhost
    labels:
      job: varlogs
      __path__: /var/log/*log

- job_name: api7 # <- add new job for collect log
  static_configs:
  - targets:
      - localhost
    labels:
      job: api7
      hostname: localhost # <- update with ip address
      __path__: /usr/local/apisix/logs/*.log
Start Promtail
./promtail-linux-amd64 -config.file promtail-local-config.yaml
Check the output logs to ensure that there is a log entry containing msg="tail routine: started".
Install Loki
curl -O -L "https://github.com/grafana/loki/releases/download/v2.8.2/loki-linux-amd64.zip"
unzip "loki-linux-amd64.zip"
chmod a+x "loki-linux-amd64"
Configure Loki
wget https://raw.githubusercontent.com/grafana/loki/main/cmd/loki/loki-local-config.yaml
Start Loki
./loki-linux-amd64 -config.file=loki-local-config.yaml
Check the output logs to ensure that there is a log entry containing msg="Loki started".
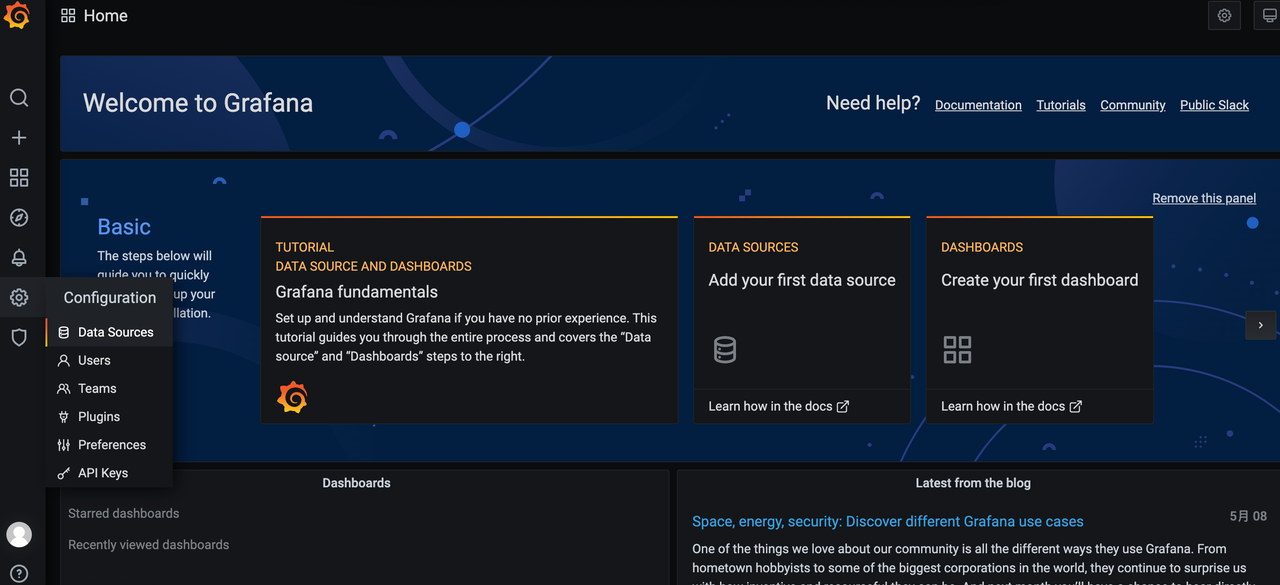
Configure Grafana
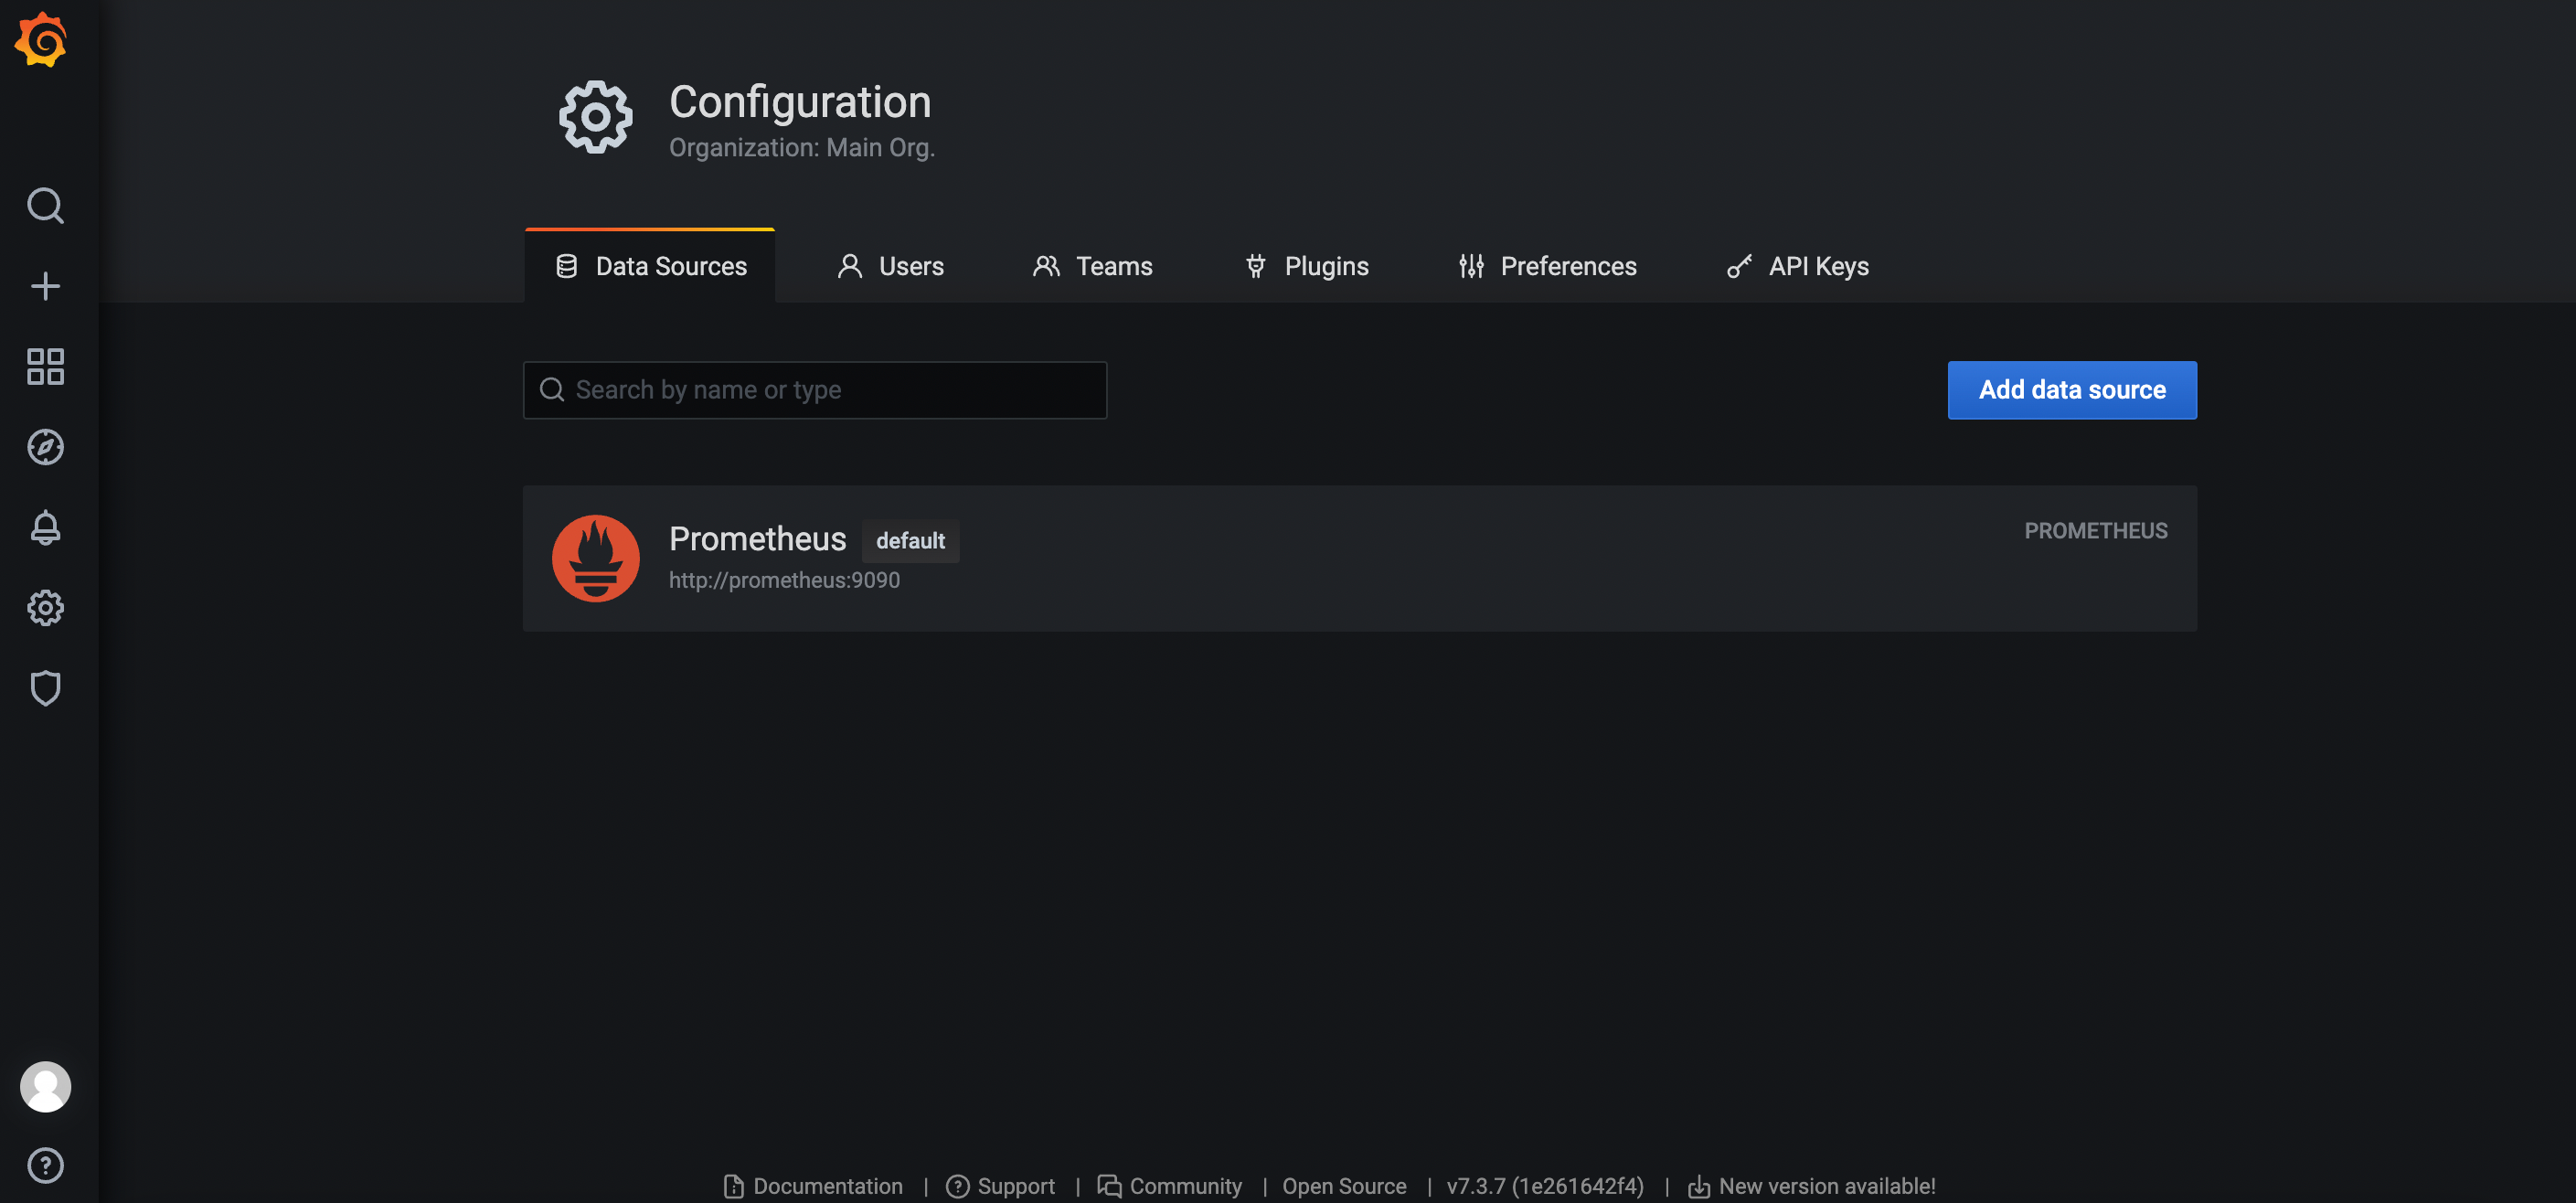
On the left menu,select Configuration > Data Sources:
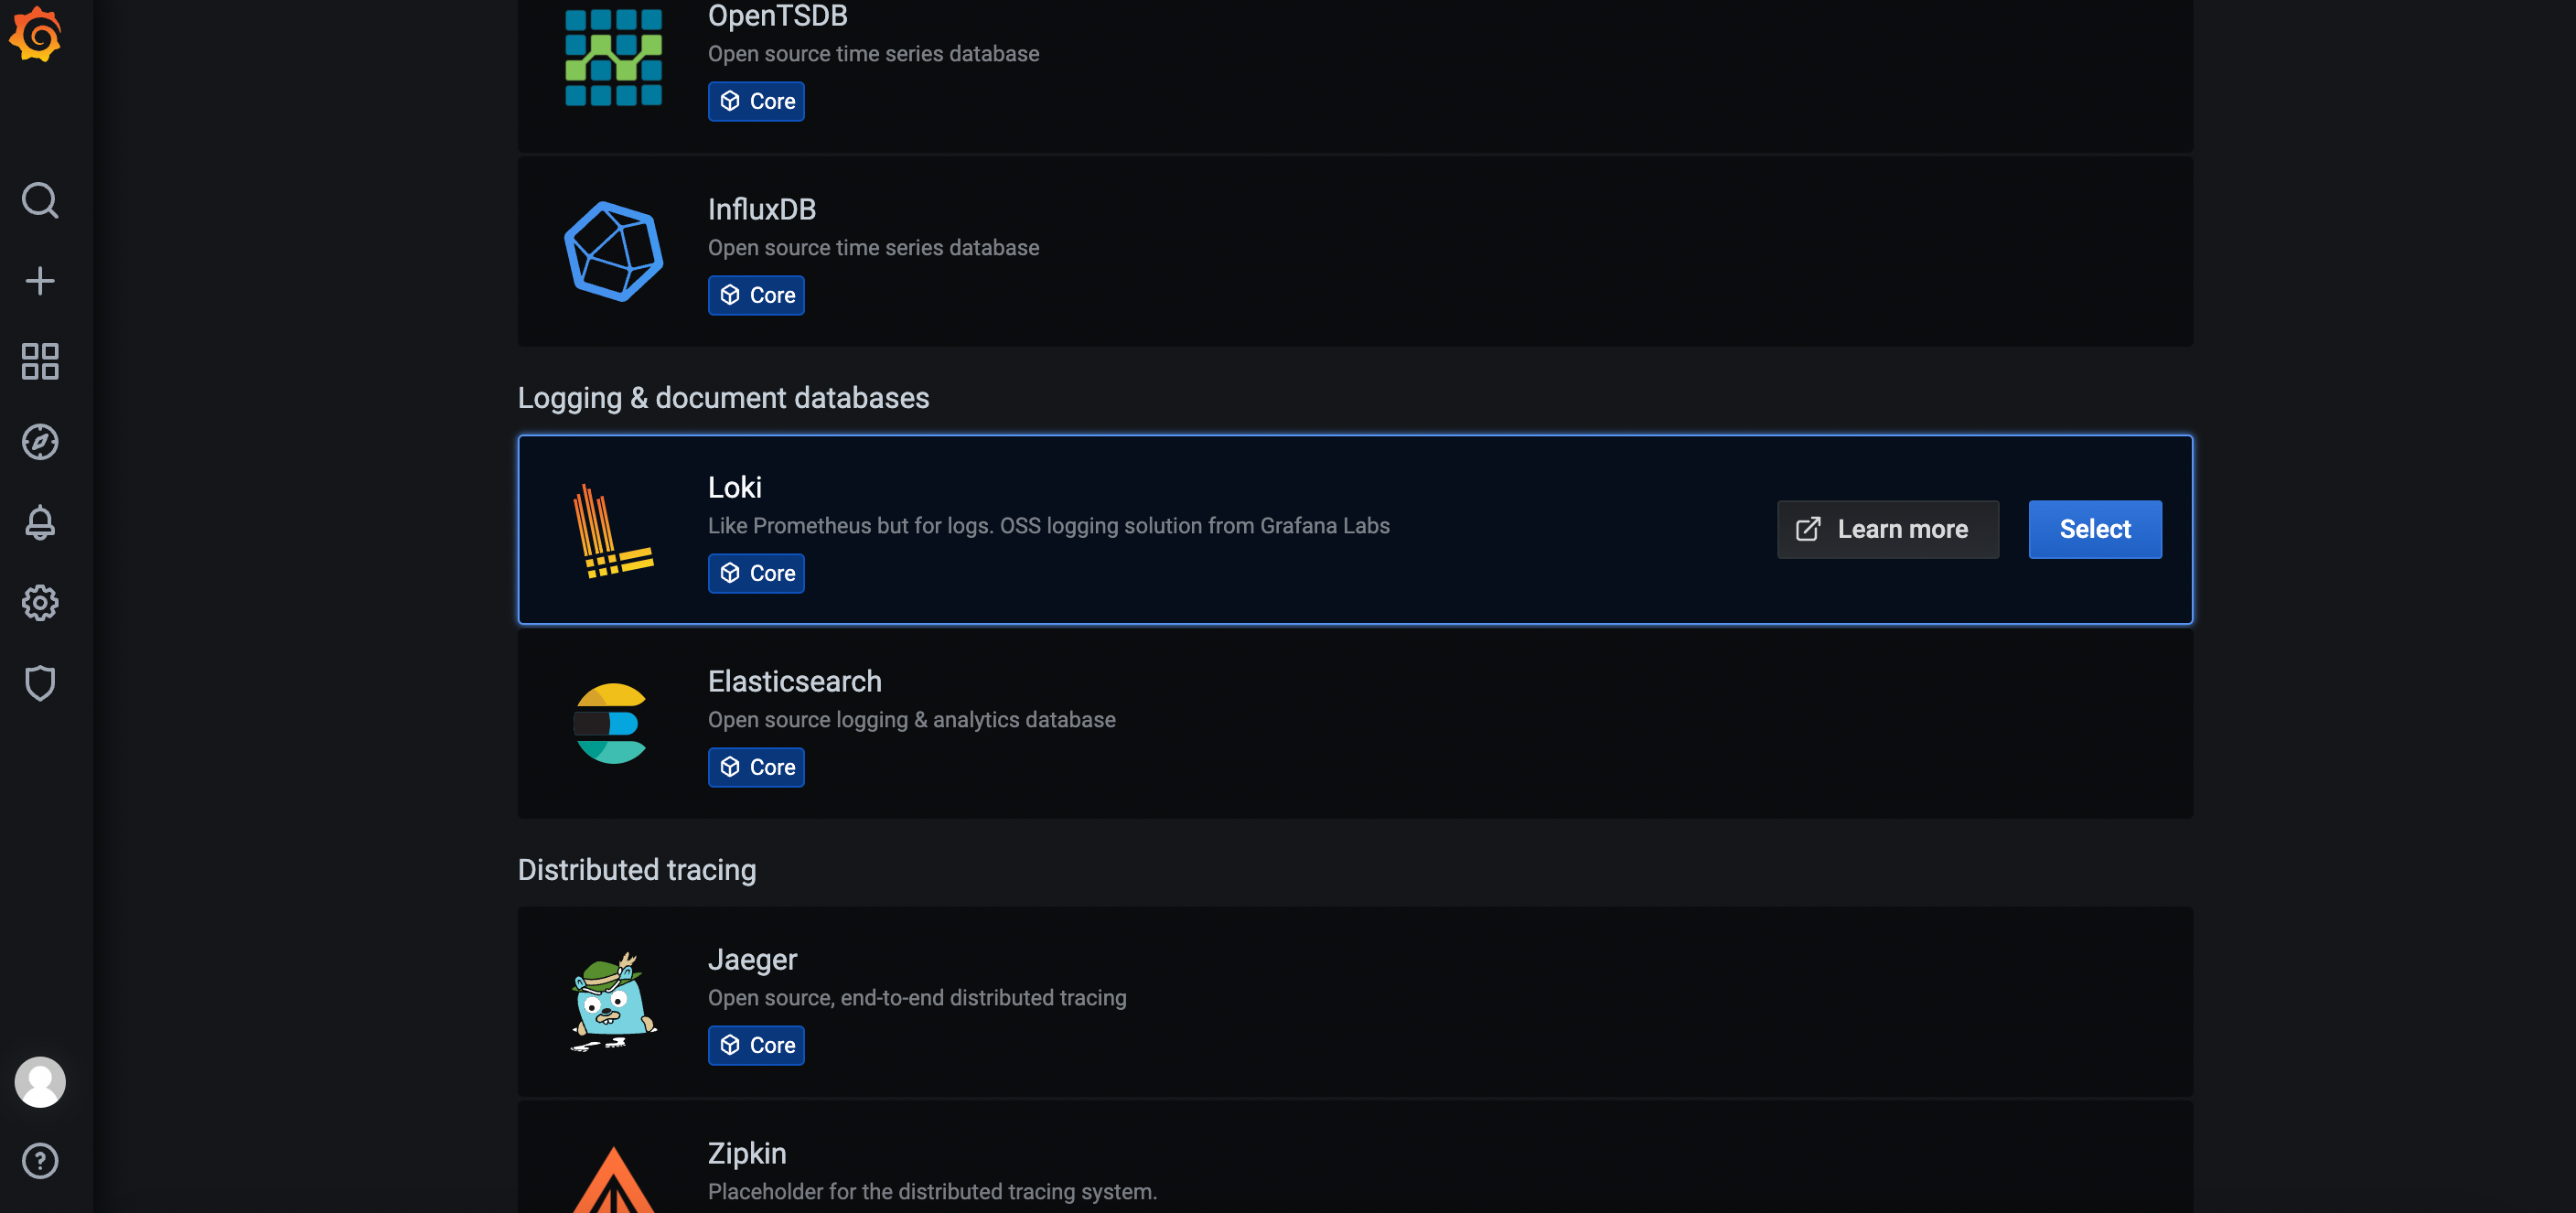
Click Add data source:
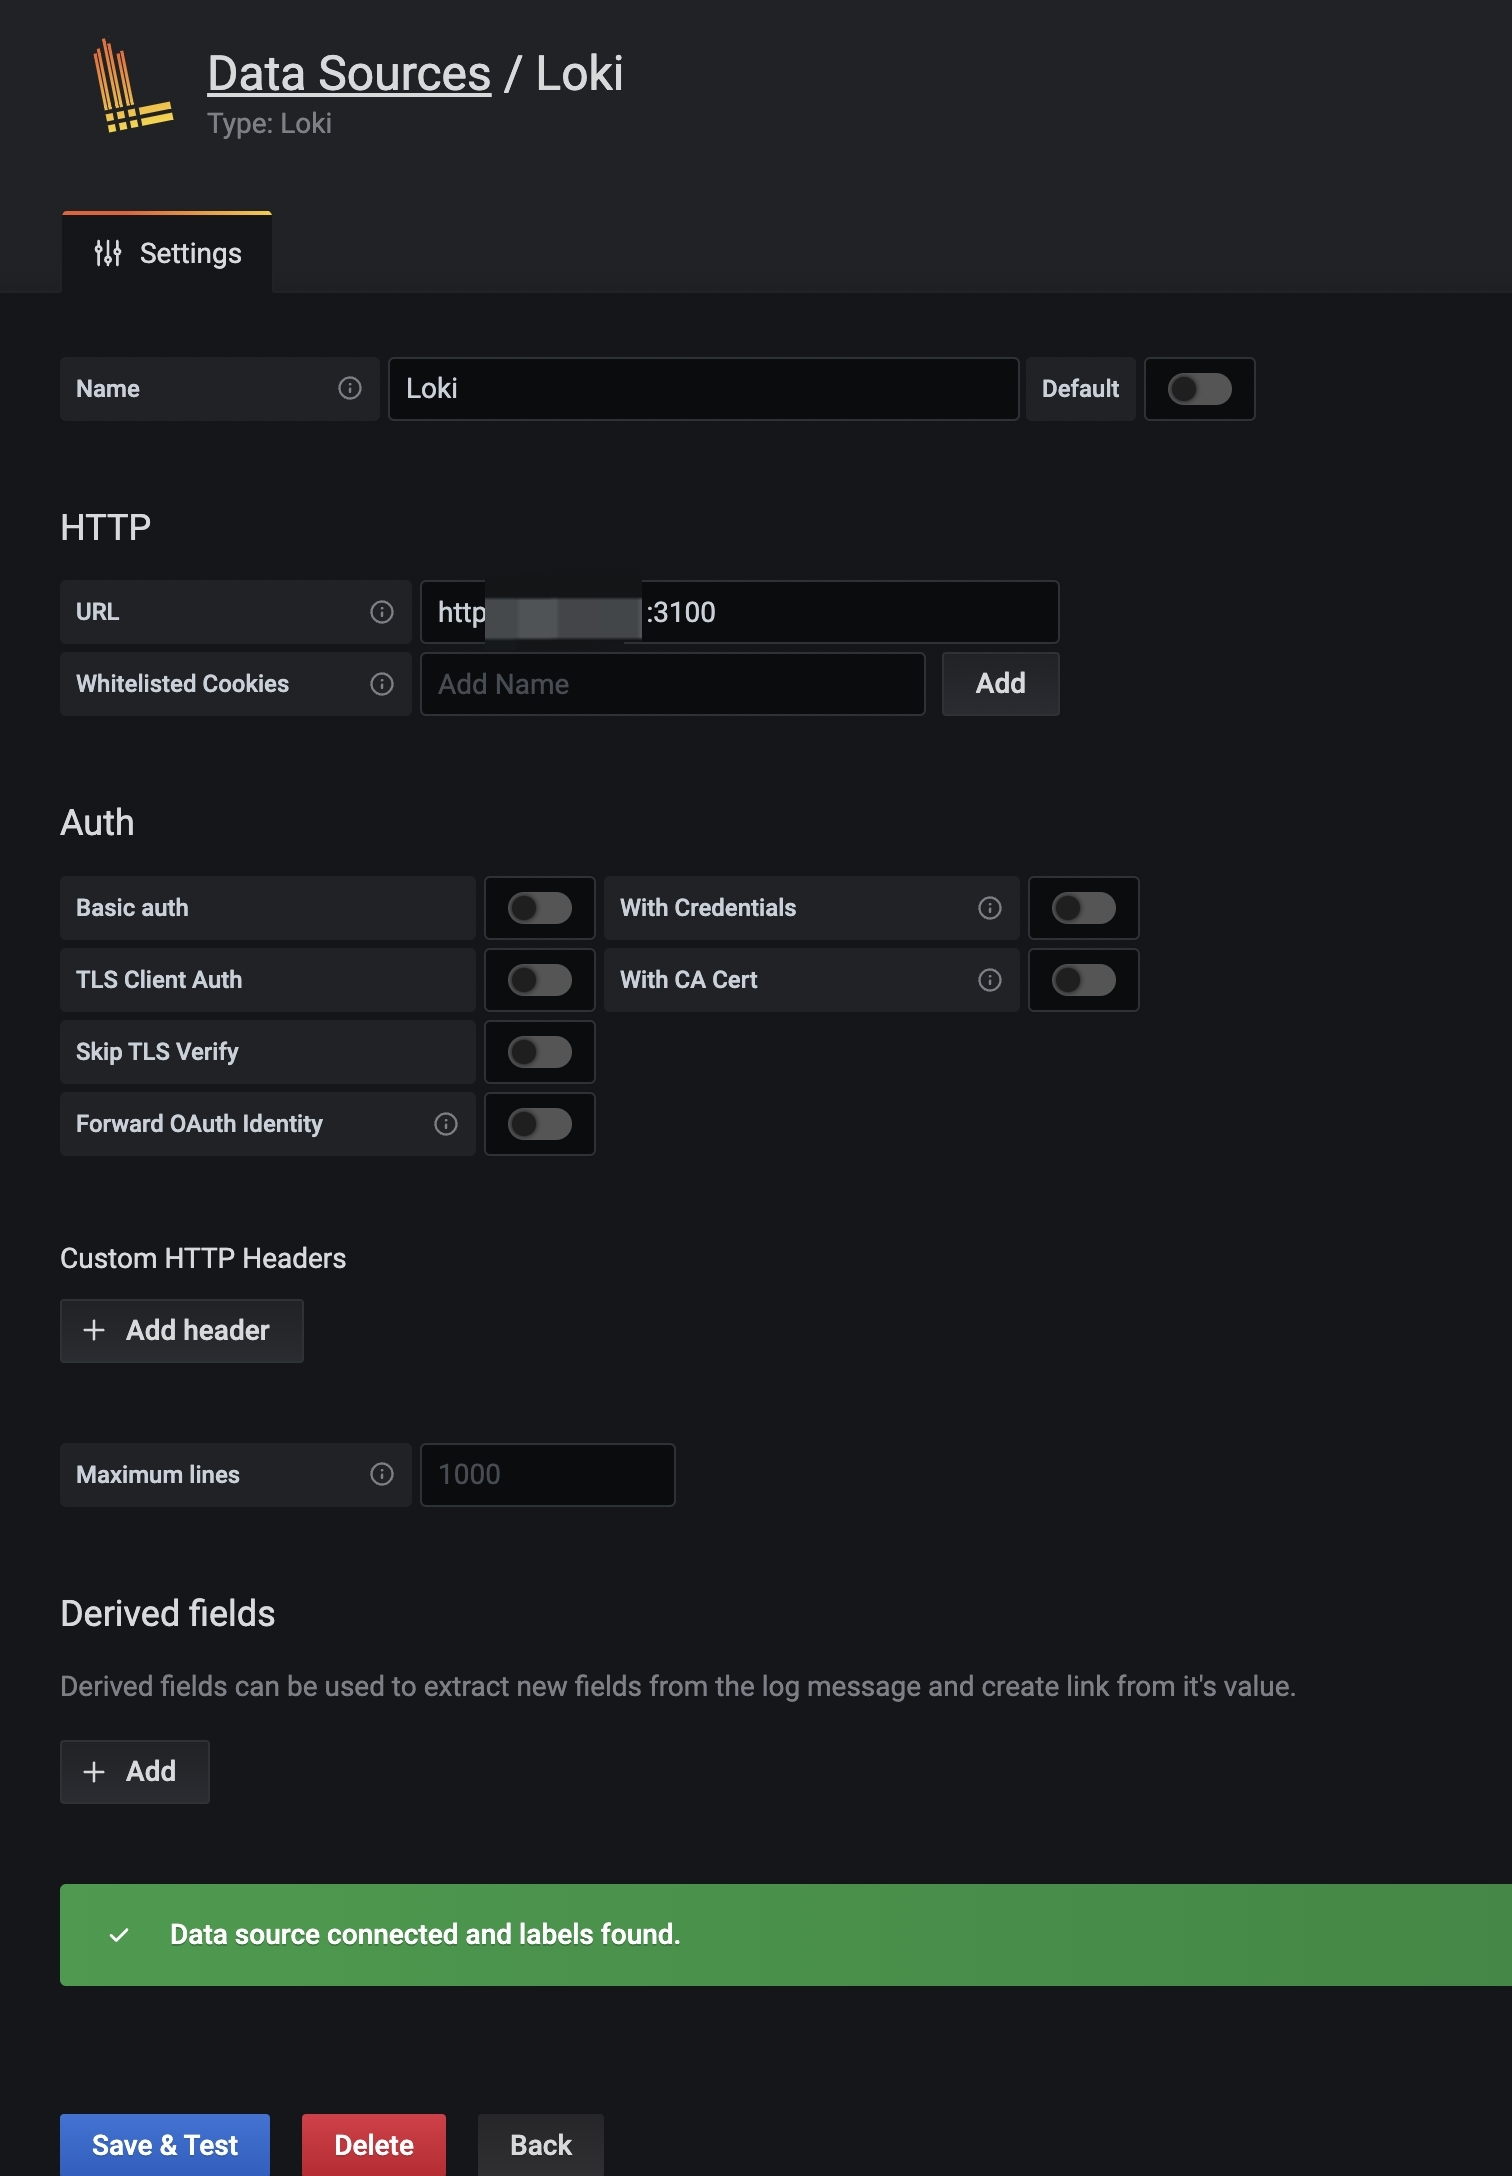
Select Loki:
Modify HTTP > URL to Loki address http://<YOUR_LOKI_ADDRESS>:3100 then click Save & Test.
On the left menu,select Explore ,then select Loki, and select job api7:
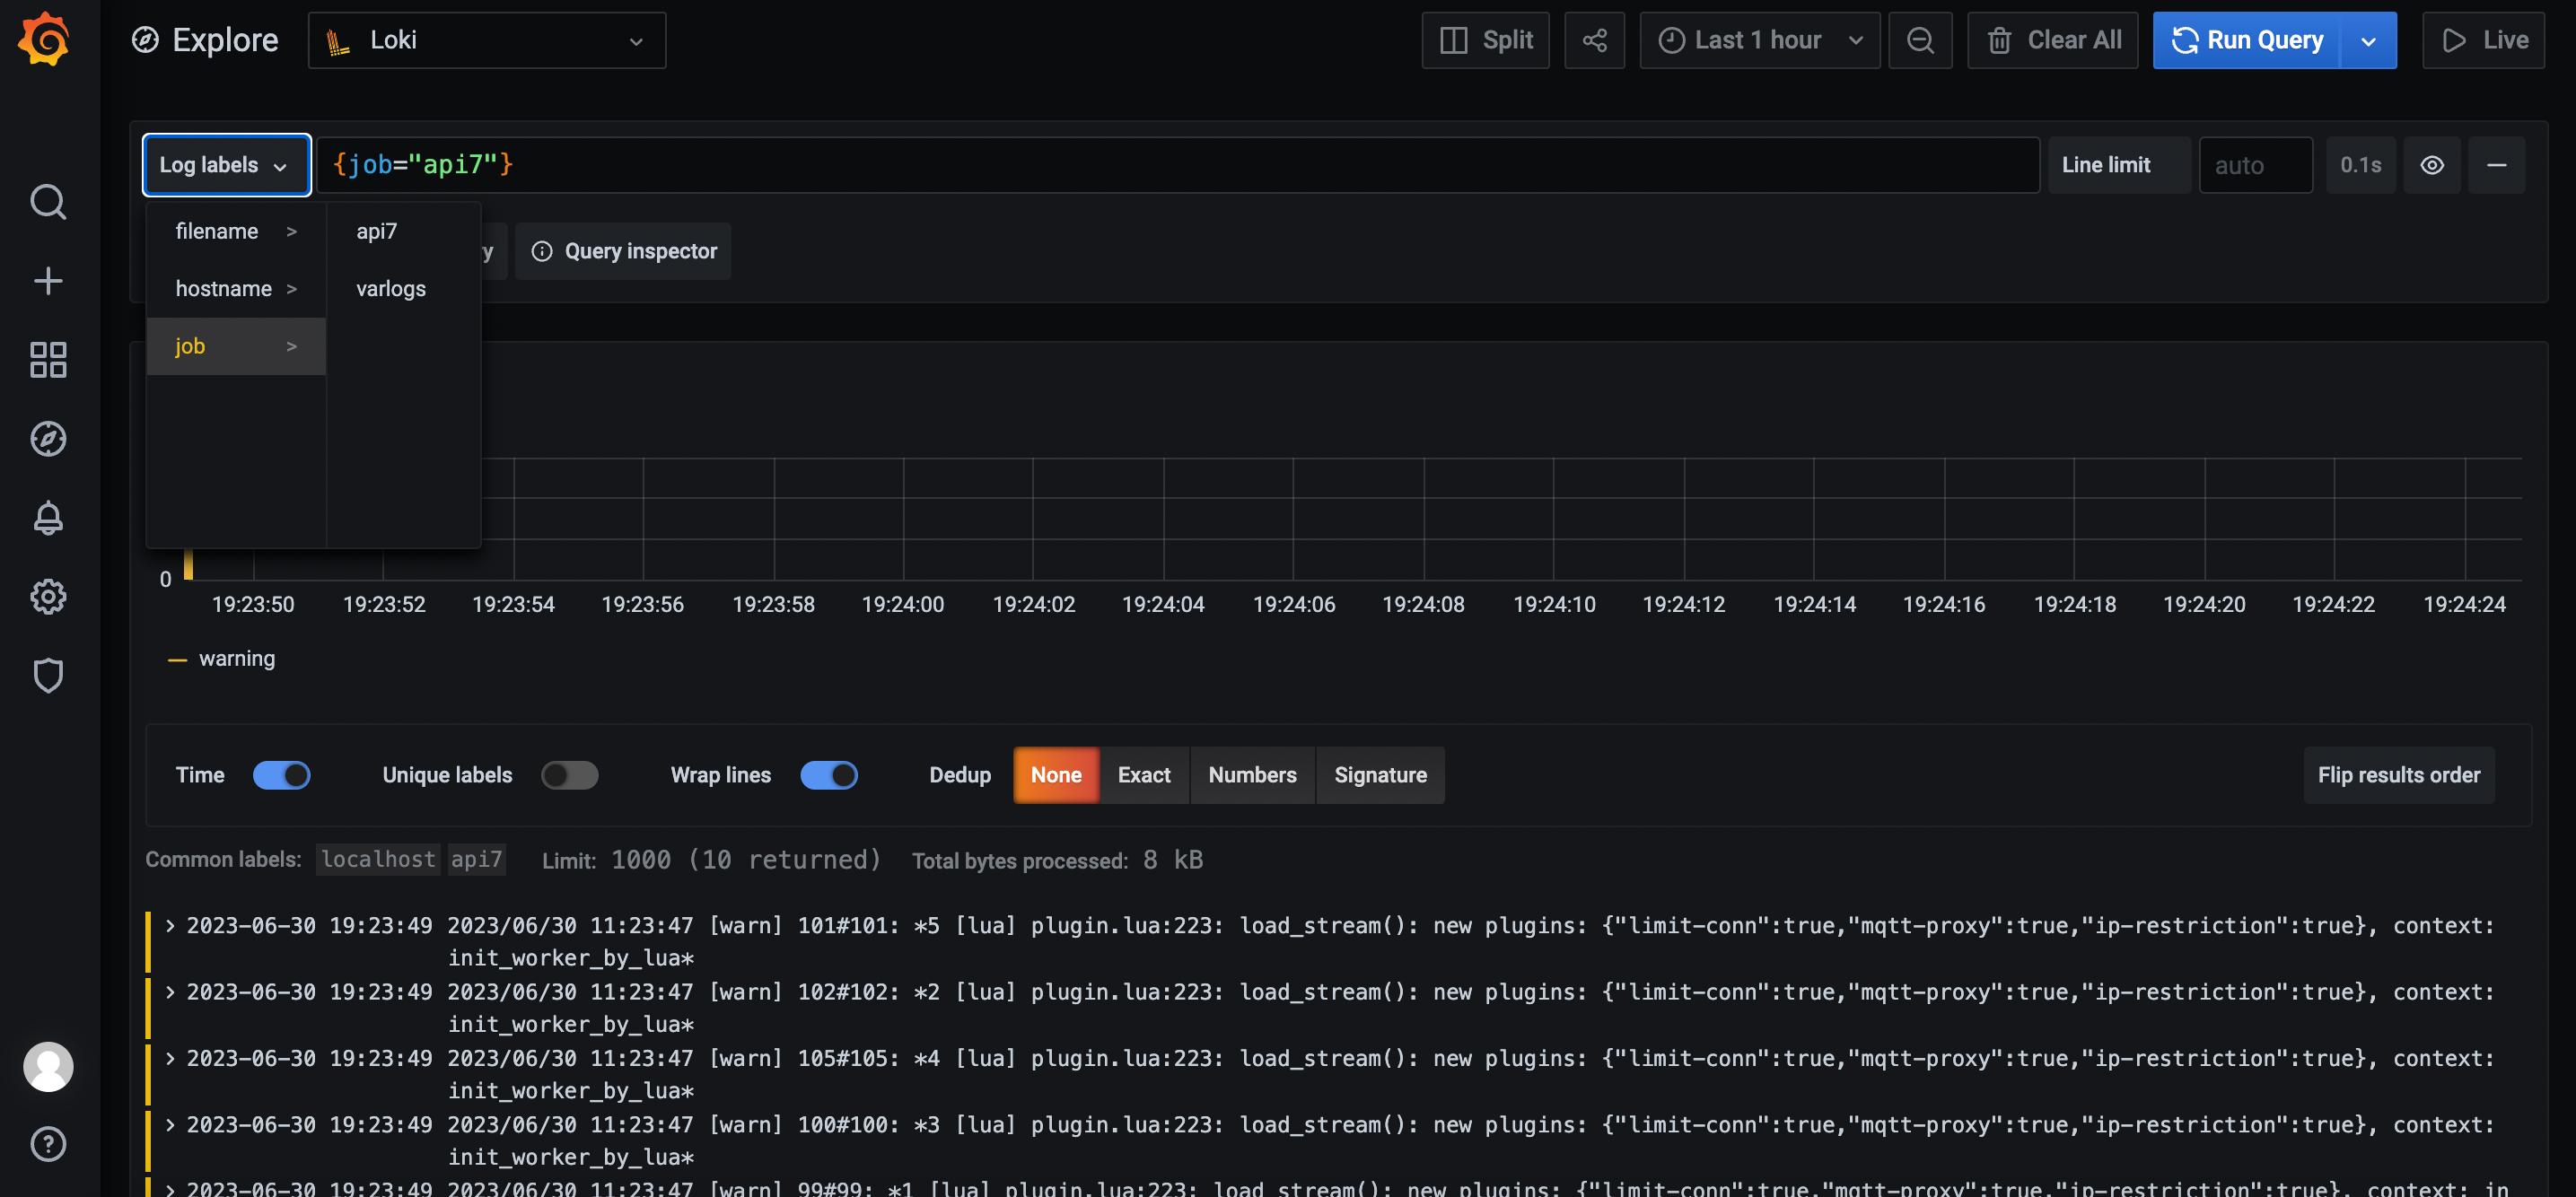
Check your logs there.