Forward Error Logs from Kubernetes to Splunk
In a production environment, timely collection and analysis of error logs are essential for maintaining system stability and facilitating troubleshooting.
This guide explains how to collect error logs from multiple API7 Gateway instances running in a Kubernetes environment and send them to Splunk for centralized log management. To achieve this, you will use Splunk OpenTelemetry Collector for Kubernetes, a dedicated solution for collecting logs from Kubernetes pods.
Prerequisite(s)
- Deploy API7 Gateways in Kubernetes cluster.
- Install Splunk.
Deploy Splunk
You can choose to use Splunk's cloud service or deploy Splunk locally. If you have already deployed Splunk, you can skip to the next step to Create Splunk HEC Token.
Create a docker-compose file for Splunk:
services:
  splunk:
    image: splunk/splunk:8.2.3
    container_name: splunk
    hostname: splunk
    environment:
      - SPLUNK_START_ARGS=--accept-license
      - SPLUNK_PASSWORD=yourpassword123
      - SPLUNK_HEC_TOKEN=your-hec-token
    ports:
      - "8000:8000"
      - "8088:8088"
      - "8089:8089"
    healthcheck:
      test: ["CMD", "curl", "-f", "http://localhost:8000"]
      interval: 30s
      timeout: 10s
      retries: 3
    restart: unless-stopped
Start Splunk:
docker compose up -d
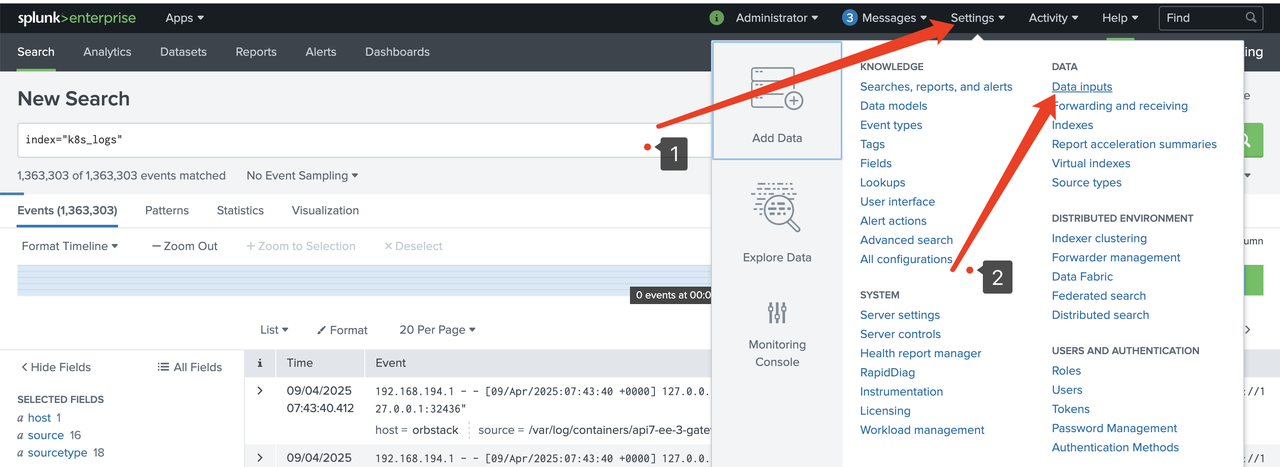
Create Splunk HEC Token
Go to Settings > Data inputs:
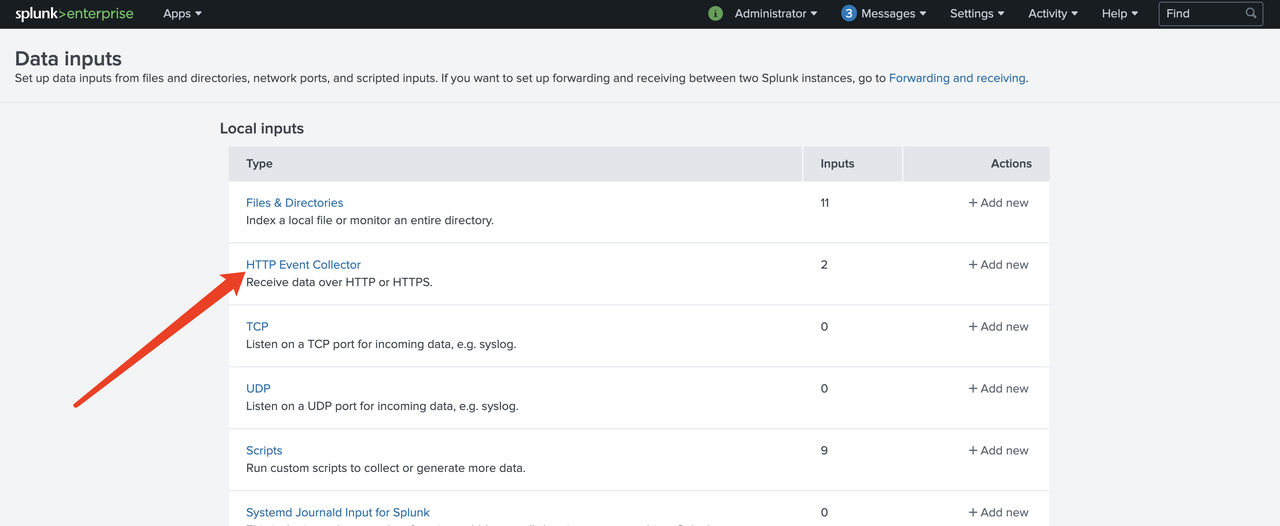
Select HTTP Event Collector:
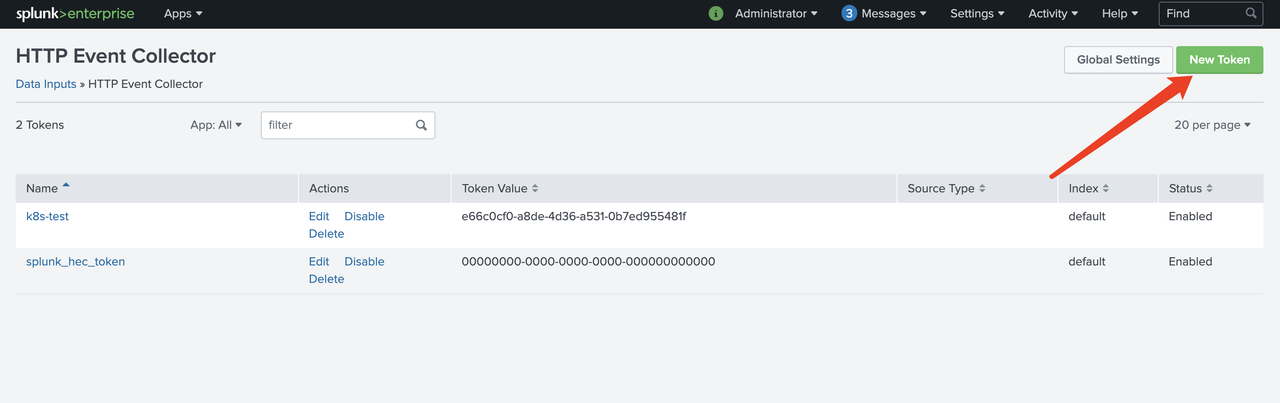
Create a new token:
Create Splunk Index
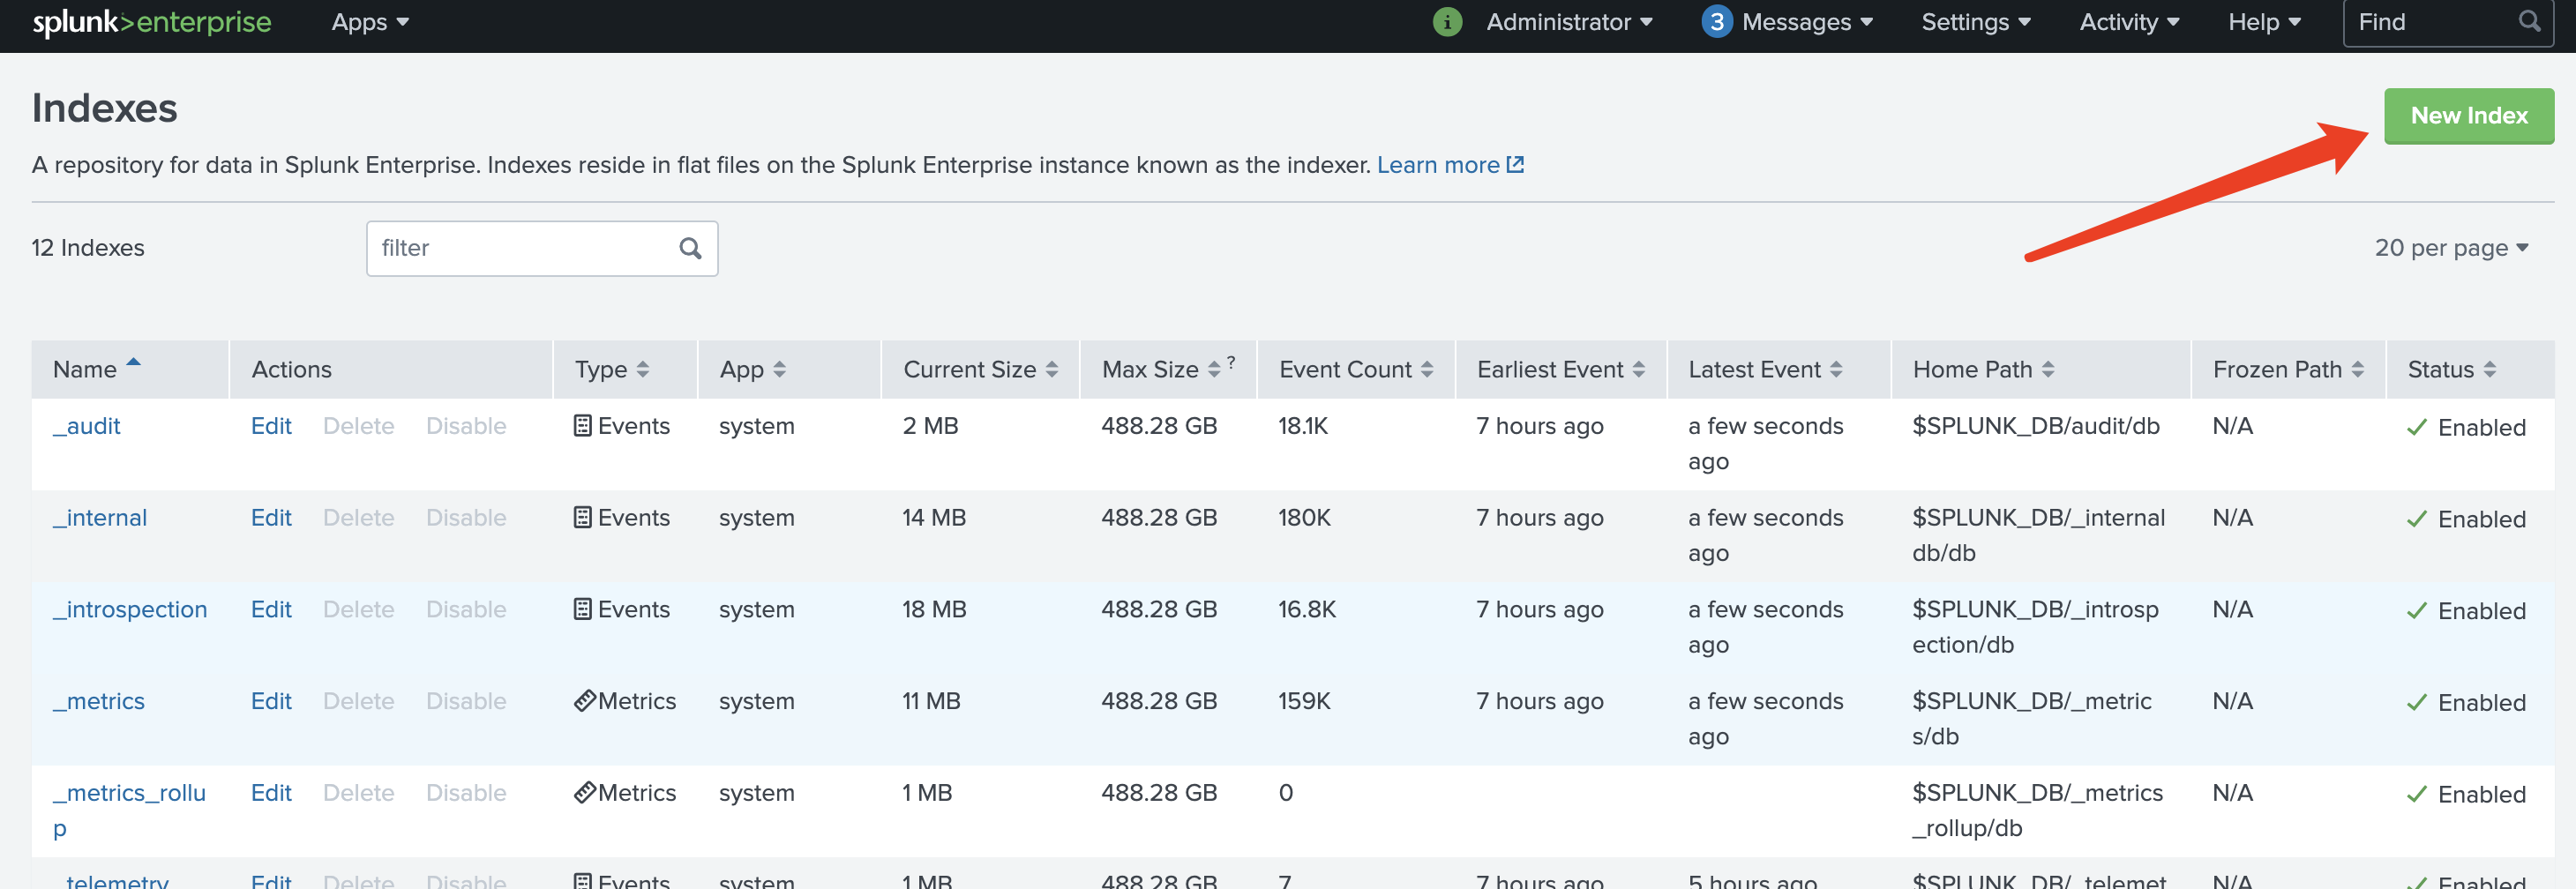
To create an index in Splunk to collect error logs, go to Indexes:
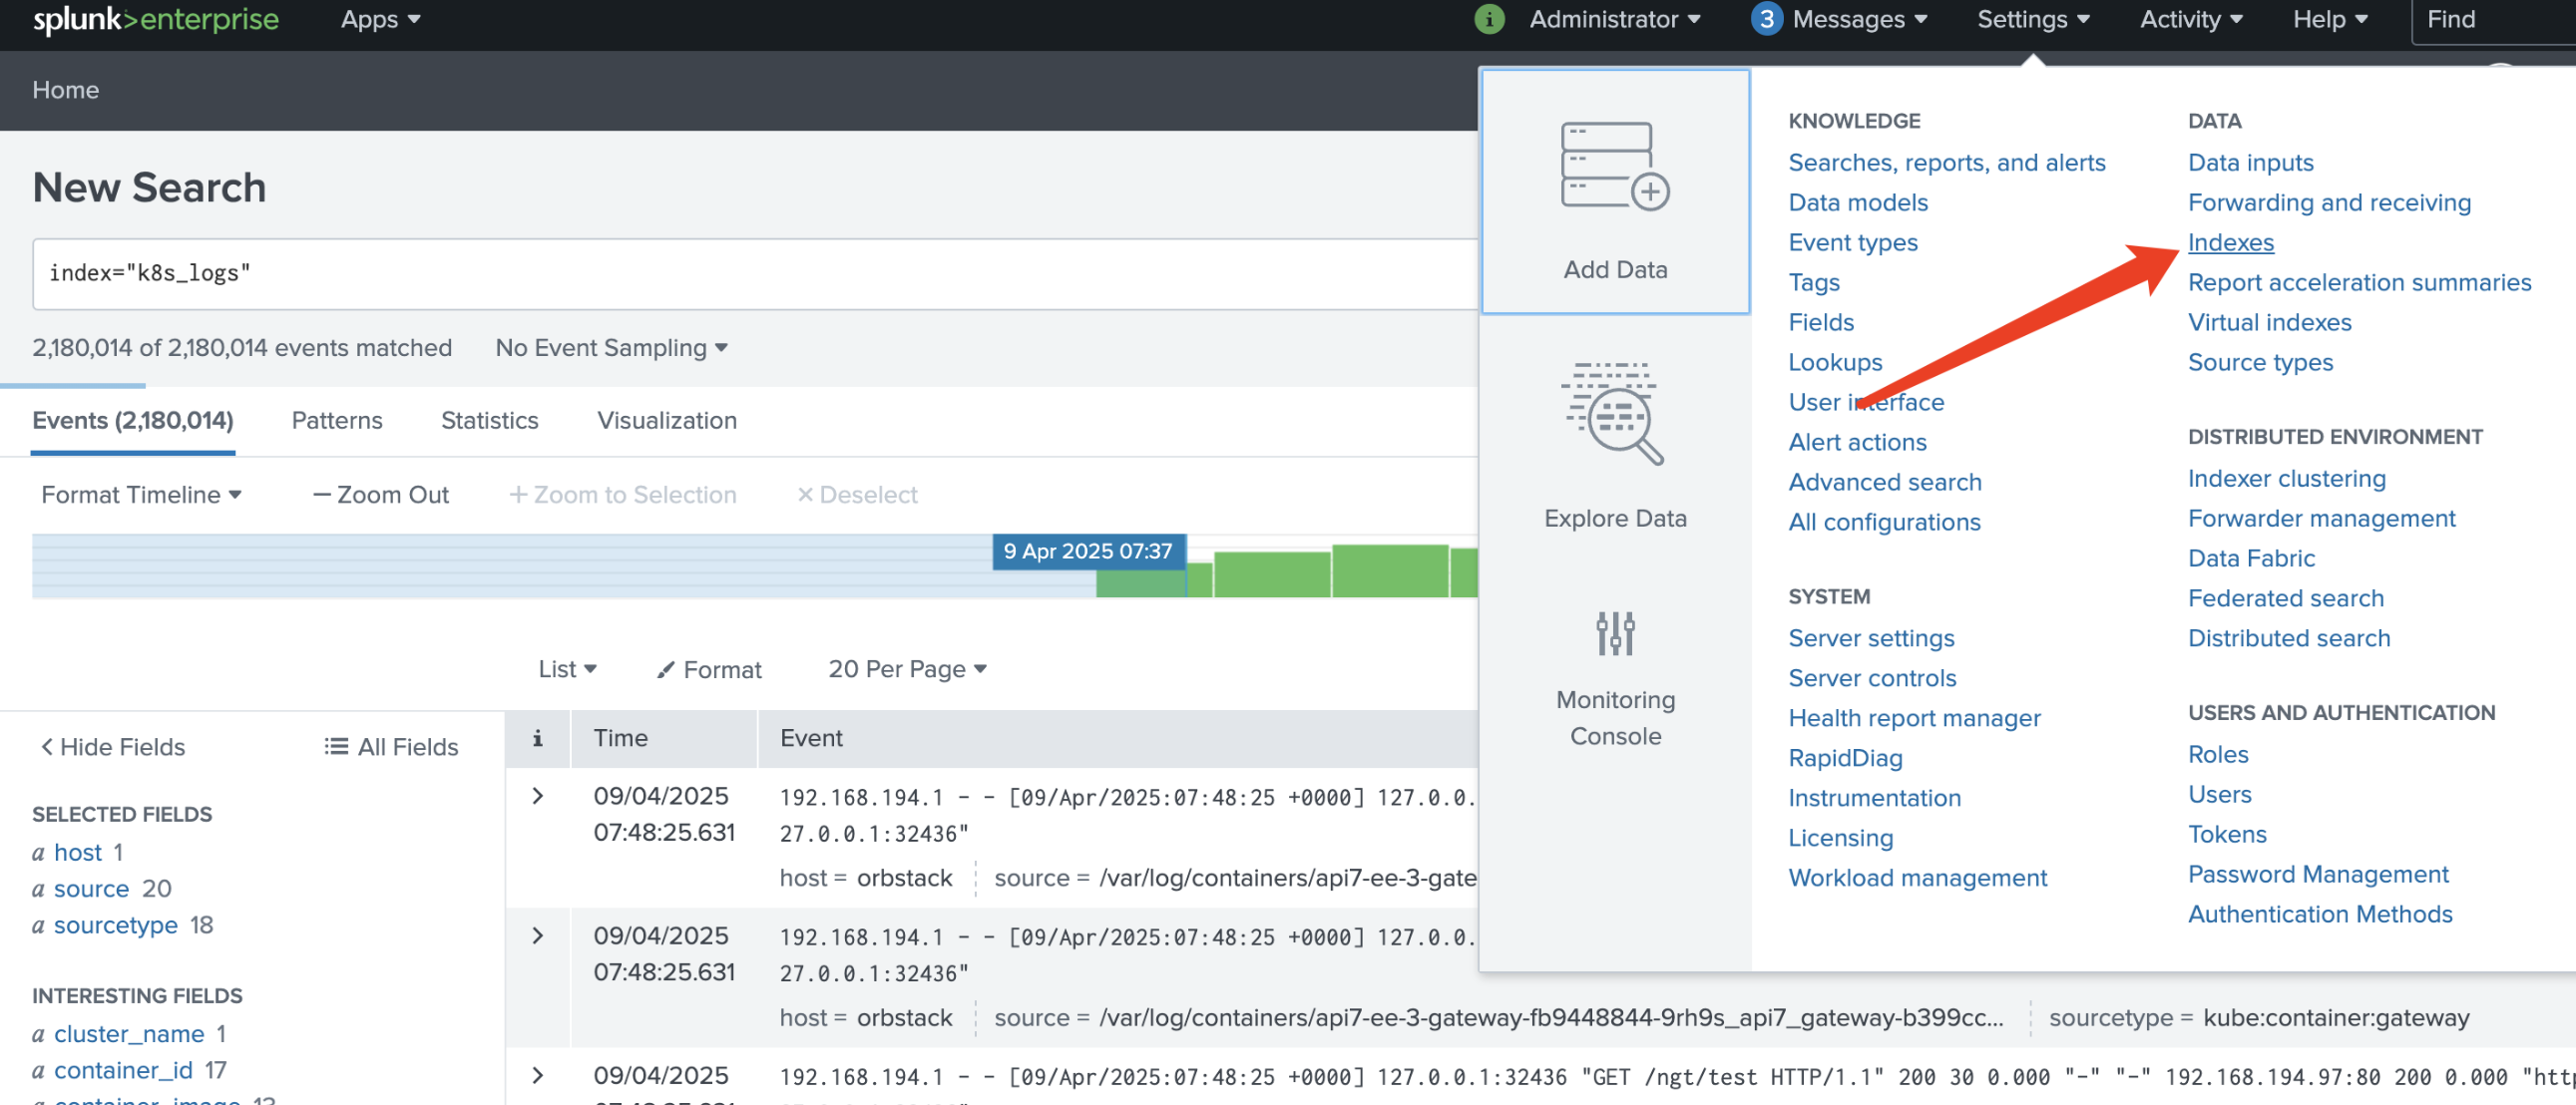
For example, you can create an index named gateway_error_logs:
Deploy Splunk OpenTelemetry Collector for Kubernetes
Create a values file for the Helm chart:
clusterName: "my-cluster"

splunkPlatform:
  endpoint: "https://{Your_Splunk_Host}:8088/services/collector/event"
  token: "your-hec-token"
  index: "gateway_error_logs"
  insecureSkipVerify: true

  logsEnabled: true
  metricsEnabled: false
  tracesEnabled: false

logsEngine: "otel"
logsCollection:
  containers:
    enabled: true
    excludeAgentLogs: true
    extraOperators:
    # https://github.com/open-telemetry/opentelemetry-collector-contrib/blob/main/pkg/stanza/docs/operators/README.md
      - type: "filter"
        expr: 'not (body matches "(?i)(error|exception|fail|fatal)")'

agent:
  resources:
    limits:
      cpu: 1
      memory: 512Mi
    requests:
      cpu: 200m
      memory: 256Mi
To learn more about advanced Splunk OpenTelemetry Collector for Kubernetes configurations, refer to the official Helm chart configuration file.
Install Splunk OpenTelemetry Collector for Kubernetes:
helm repo add splunk-otel-collector https://signalfx.github.io/splunk-otel-collector-chart
helm repo update
helm upgrade --install my-splunk-otel-collector -n logging --create-namespace -f values.yaml splunk-otel-collector-chart/splunk-otel-collector
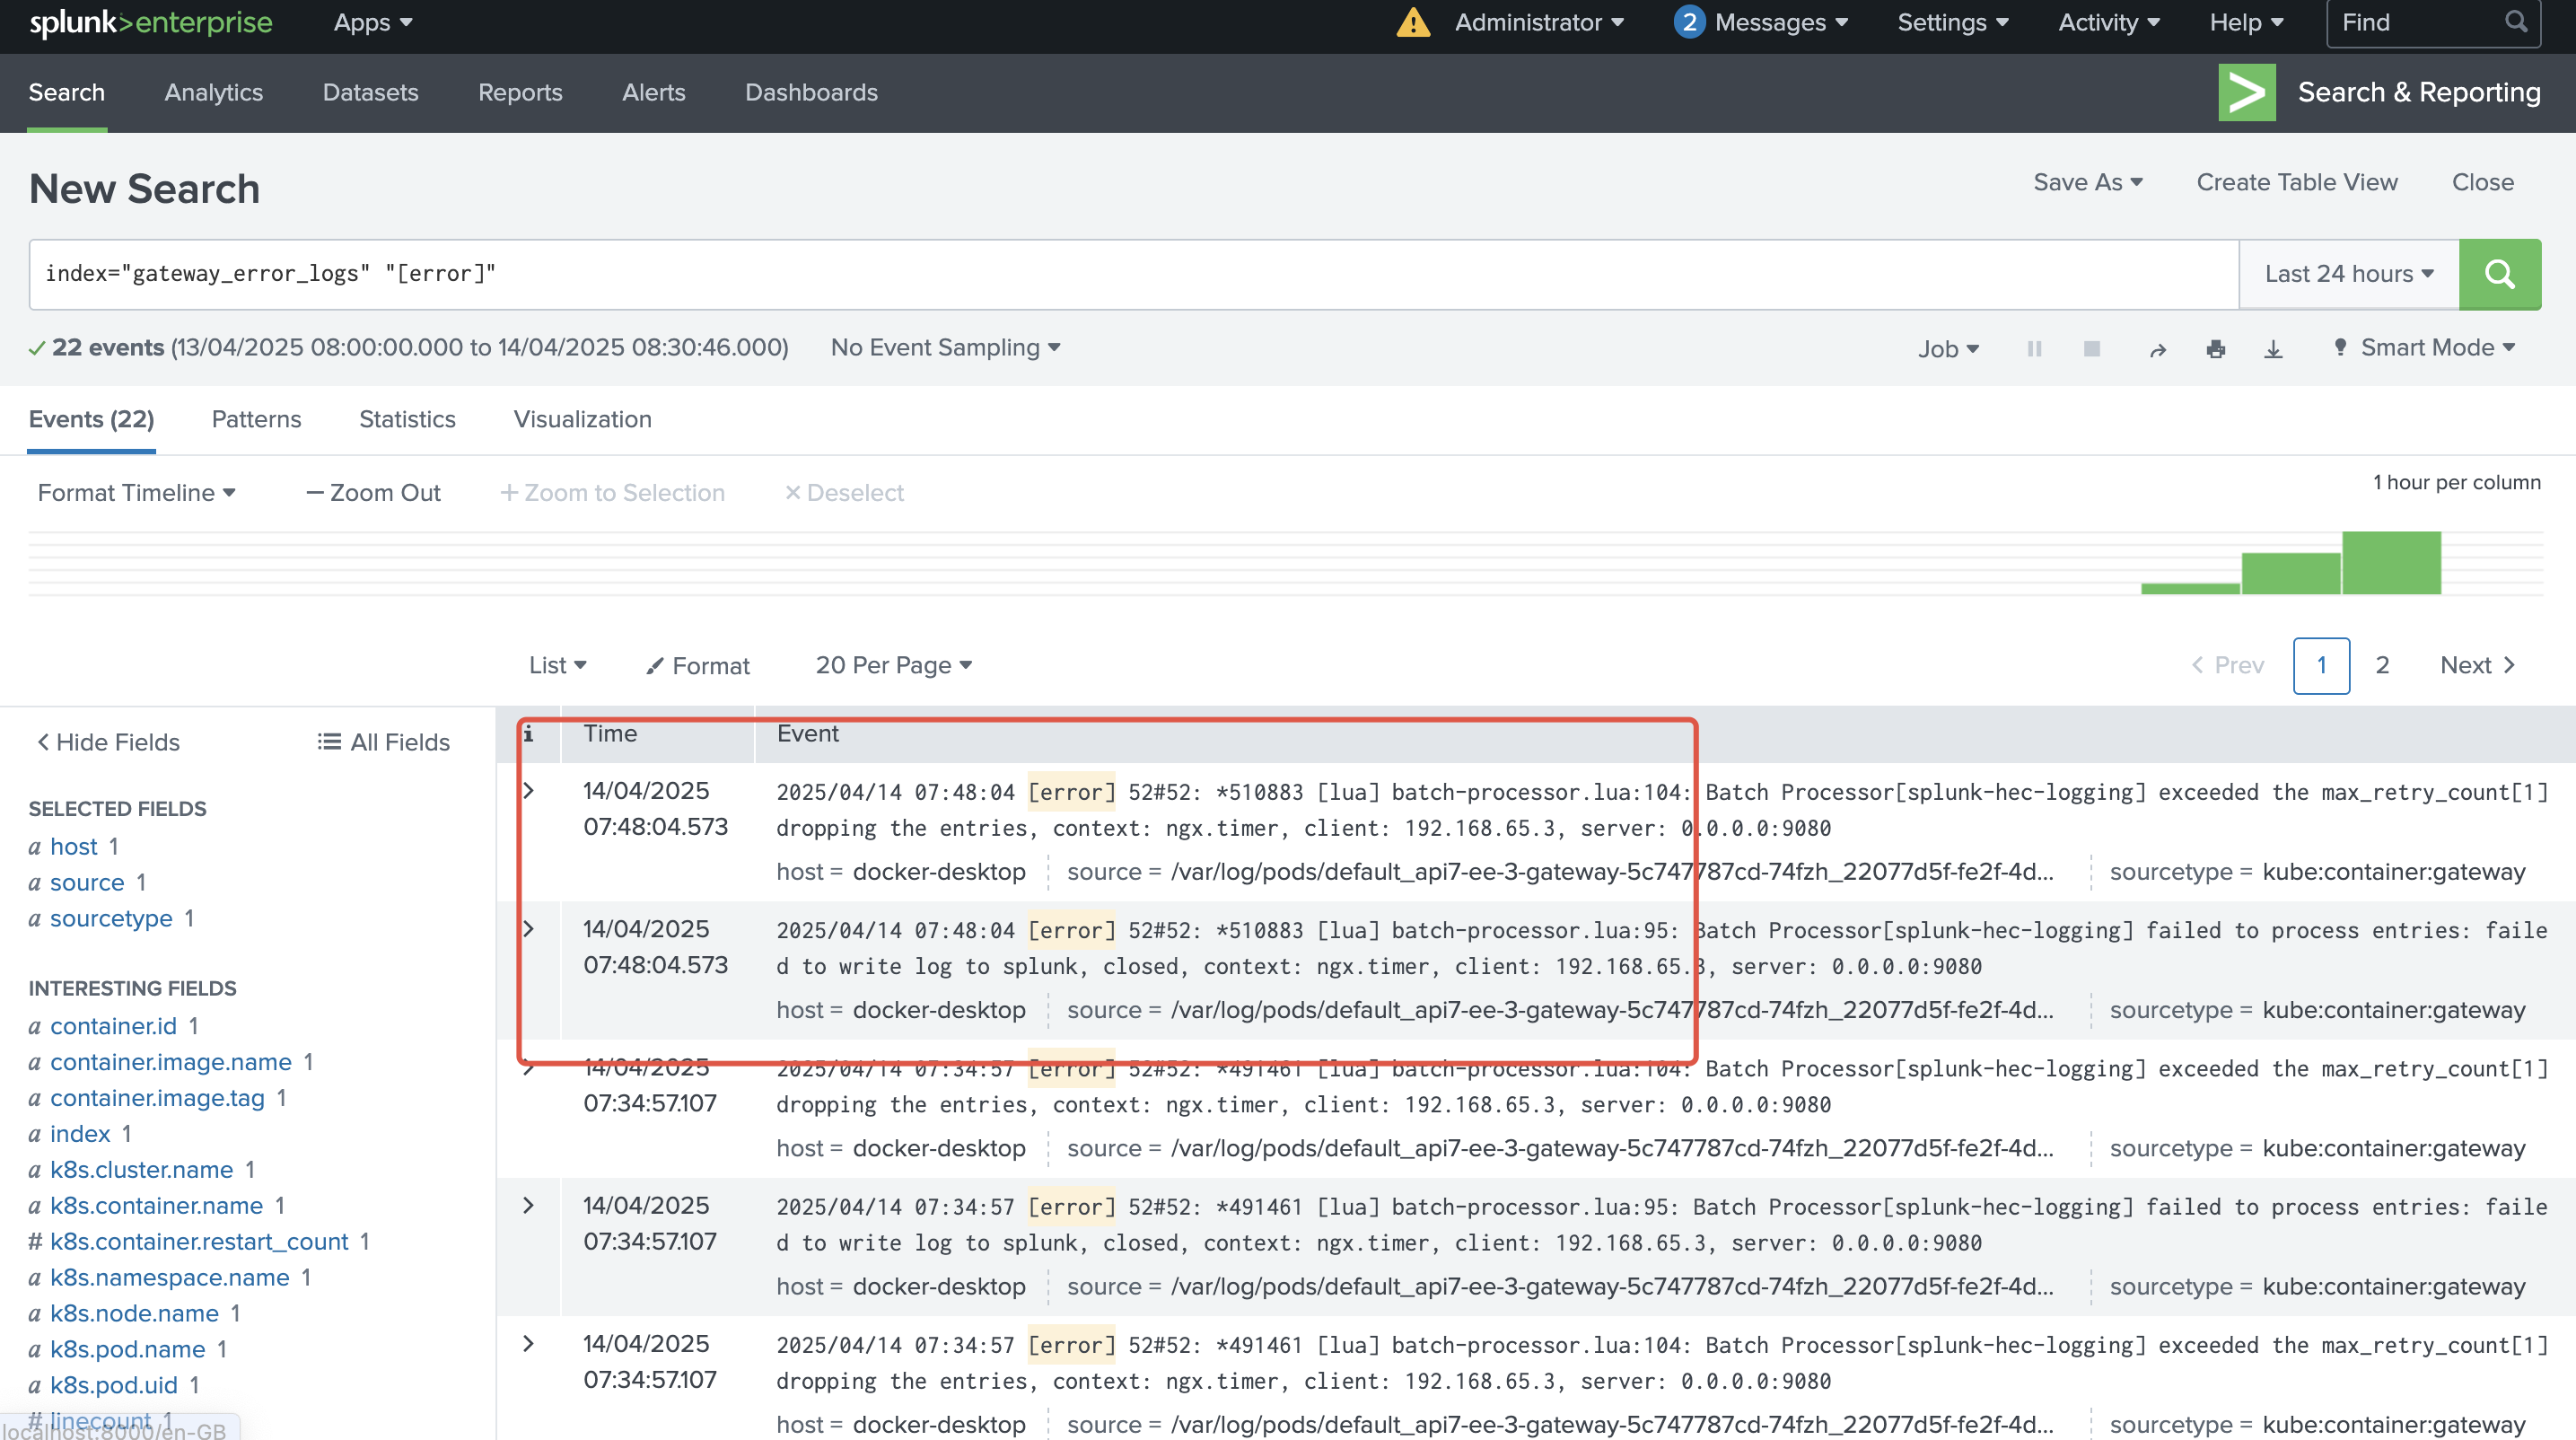
Verify Log Collection
Generate any error log in the API7 Gateway. In the Splunk management console, search for index="gateway_error_logs" "[error]" to view the corresponding error logs: