Usage Reporting
AISIX Cloud uses managed gateway telemetry to report traffic volume, token consumption, latency, cost, and cache savings. These usage views help platform and finance teams understand consumption across environments and explain budget behavior.
Use the Usage view when the question is about aggregate consumption: how many requests were served, which environments or models drove spend, and whether usage records are reaching AISIX Cloud.
How Usage Is Reported
A managed gateway serves AI traffic in your runtime environment and reports usage events back to AISIX Cloud.
The managed gateway derives its telemetry endpoint from the AISIX Cloud manager URL and sends usage-oriented data to the fixed /dp/telemetry path. Operators do not configure a separate telemetry destination for Cloud usage reporting.
Usage events include request outcome and consumption signals such as status, latency, token usage, and cost when those values are available.
Usage events also distinguish the model alias the caller requested from the resolved model that served an attempt. This helps interpret routed and ensemble traffic. Streaming chat requests can also report time to first token.
What Usage Shows
The Usage view summarizes managed gateway traffic across environments. It can show request count, token totals, spend, cache savings, usage by environment, and top models.
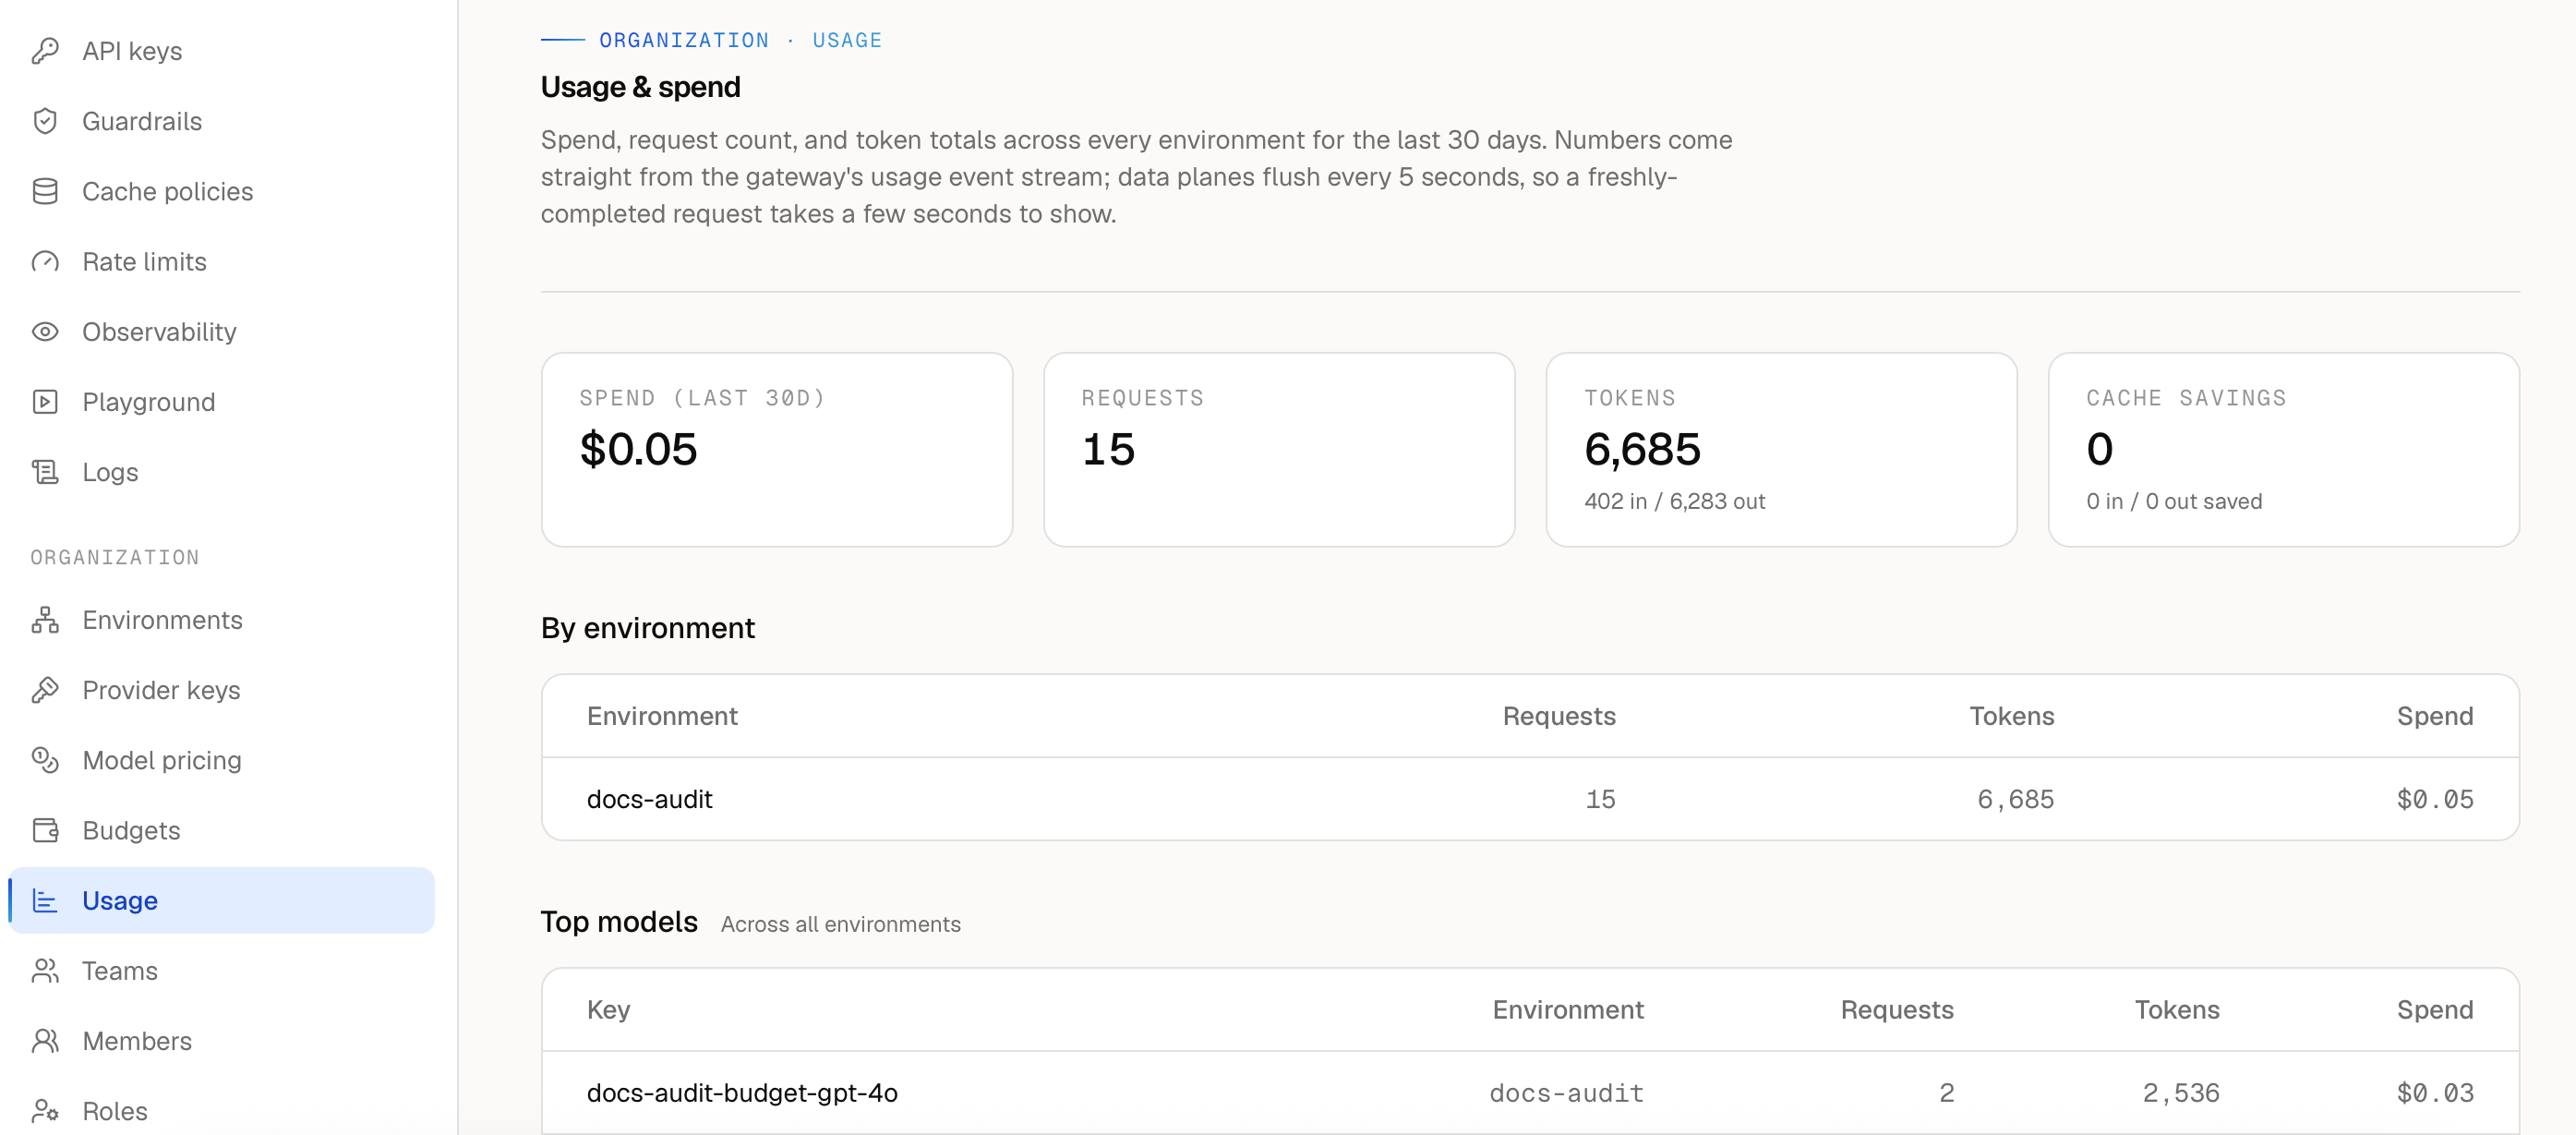
Token counts and cost appear only when AISIX can observe or derive those values from the provider response and configured pricing data.
Use the Usage view to understand trends over time. Use request logs when you need to inspect a single request outcome.
Usage and Budget Enforcement
AISIX Cloud uses managed gateway usage records to evaluate managed budgets. The budget policy controls the scope, limit, and enforcement mode.
When a hard-stop budget is exceeded, the managed gateway can reject affected requests with HTTP 429. Warn-only budgets appear in Cloud without blocking traffic.
If a budget rejection is unexpected, check the budget scope and limit first. If the policy looks correct but usage appears incomplete, then confirm the request went through the expected managed gateway and environment.
When Usage Looks Incomplete
If usage does not reflect the traffic you expected, first confirm the request went through the managed gateway attached to the expected environment. Usage records are scoped to managed gateway traffic for that environment, so requests sent to another gateway endpoint or another environment appear elsewhere.
If the request path is correct, check that the managed gateway has a recent heartbeat and can reach AISIX Cloud telemetry endpoints.
Live traffic can continue from the latest projected configuration during temporary Cloud connectivity loss. Usage reporting, budget evaluation, exporter health, and heartbeat all depend on restored connectivity.
Next Steps
Continue with Logging and Auditing when you need to investigate individual request outcomes or Cloud resource changes.