Logging and Auditing
The AISIX managed control plane gives operators two evidence trails: request logs for managed gateway traffic and an audit log for control-plane state changes. Together, they help teams understand what happened to a request and who changed the resources that affect traffic.
Use request logs to investigate a specific managed gateway request. Use the audit log to investigate configuration, access, and other control-plane changes.
Request Logs
Request logs are built from managed gateway telemetry. They show individual request outcomes, including request time, status, requested model, caller API key, latency, token counts, and attempt details when available.
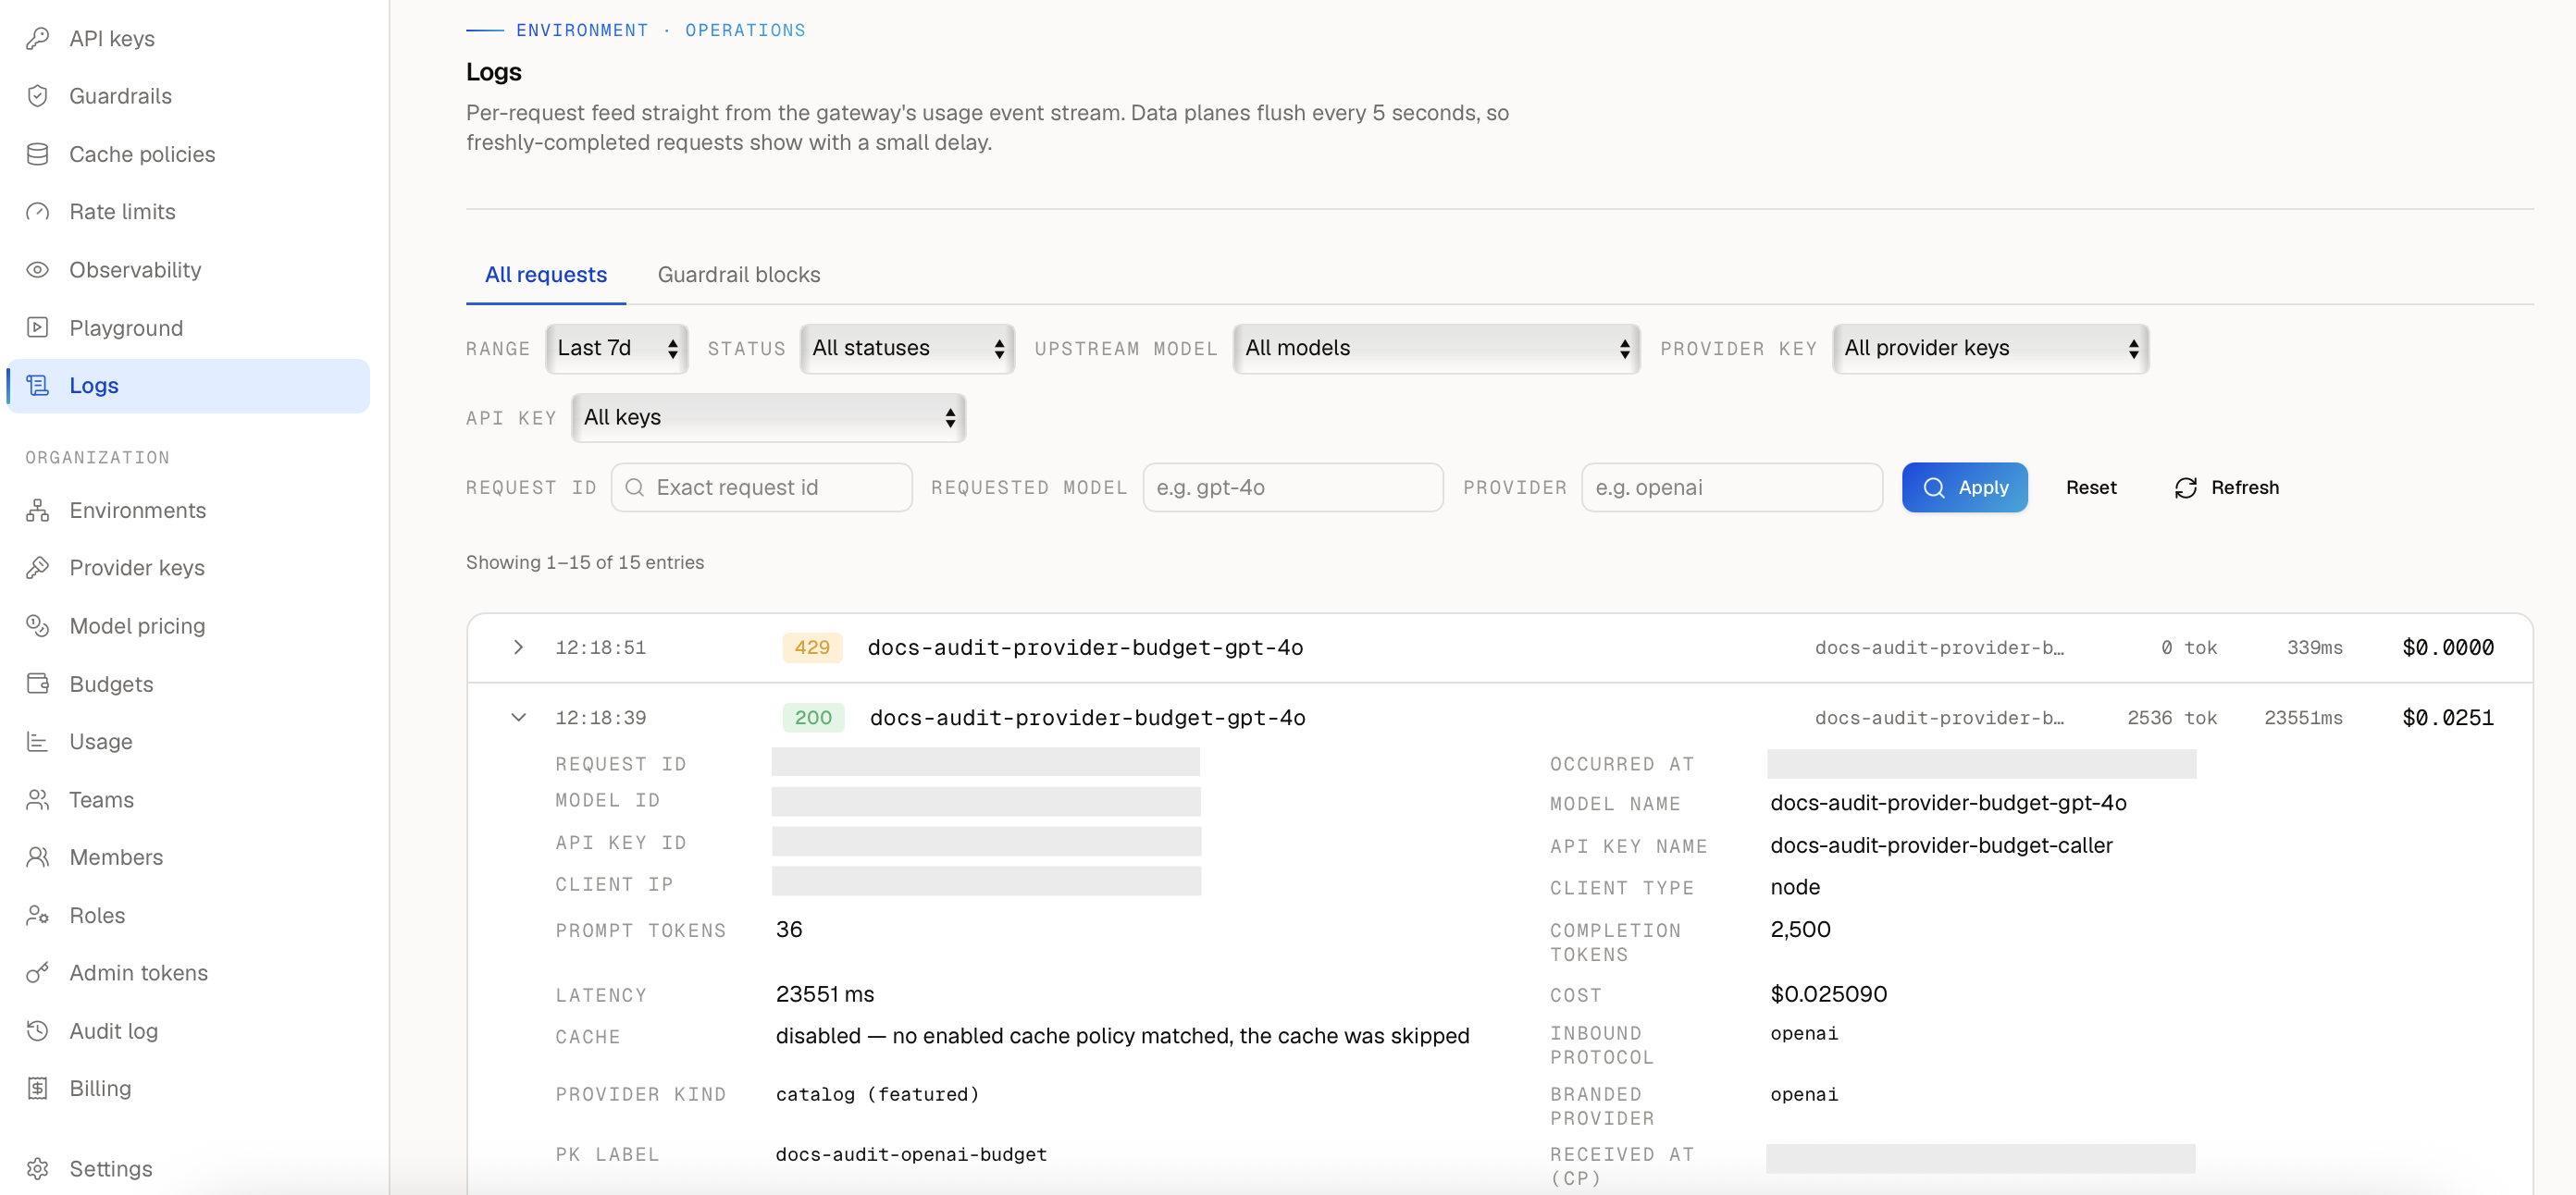
Freshly completed requests can take a few seconds to appear because data planes flush telemetry in batches.
Start with request logs when you need to verify a live request, inspect an upstream error, confirm a policy rejection, or check how routing and failover resolved a request.
Audit Log
The audit log records control-plane state changes for compliance review and operational investigation. It shows who created, updated, or deleted resources such as environments, models, API keys, provider keys, budgets, policies, and admin tokens.
Use the audit log when traffic behavior changes after a configuration update. Request logs can show the request outcome, while the audit log can show whether a control-plane resource changed before that outcome.
Audit log access is restricted to organization owners and admins.
Investigate a Request Outcome
Send the request through the managed gateway endpoint with a caller API key and model alias that belong to the same environment as the gateway.
After the request completes, check request logs for a matching request time, status, requested model, and caller API key. If the request used routing or failover, inspect the resolved model or attempt details when they are available.
An upstream authentication, quota, or provider-side error can still prove that the managed gateway path is working. In this case, the request reached AISIX. AISIX selected the configured model and provider key, then the upstream provider returned an error.
Do not treat a provider error as a resource-projection failure unless the log shows the wrong model, provider key, or environment.
Investigate Policy Rejections
Managed policies can reject traffic before AISIX calls the upstream provider. Budget hard stops return a budget-related error, and rate-limit policies return a rate-limit error. Guardrails can reject unsafe content before or after the provider call depending on the guardrail hook.
When a request is rejected, first identify whether the response came from AISIX or from the upstream provider. Then use request logs to check the status and request identity.
For budget rejections, compare the returned budget scope with the Budgets view. For rate-limit rejections, check the caller API key, model, team, or member policy that matches the request. For guardrail rejections, check the guardrail scope and the model or caller identity that triggered it.
If Traffic Does Not Appear in Request Logs
If request logs do not show the expected record, check the request path first. Request logs are scoped to managed gateway traffic for the selected environment, so requests sent to another gateway endpoint or another environment appear elsewhere.
If the request path is correct, check that the managed gateway has a recent heartbeat and can reach the control-plane telemetry endpoint.
Other control-plane signals can help narrow the cause:
| Signal | What it shows |
|---|---|
| Data planes heartbeat | Whether the managed gateway is connected to the control plane and reporting from the expected environment. |
| Usage | Whether the control plane received managed traffic telemetry for aggregate usage and budget workflows. |
| Observability exporter health | Whether the gateway has applied exporter configuration and is reporting delivery status for external telemetry destinations. |
External Exporters
Request logs show the control plane's view of managed request telemetry. Observability exporters are configured from the environment's Observability view and send usage events from the managed gateway to destinations you control.
Use exporters when you need to send request telemetry to an external tracing, logging, storage, or accounting system. Exporter delivery happens from the managed gateway directly to the destination. A request log can exist even when an external destination has a credential, network, or receiver-path issue.
Data Retention
The control plane keeps managed request telemetry for a per-organization retention window. This includes the data behind both the Request Logs and Usage views. By default, records are kept for 30 days, and the control plane automatically removes older records each day.
Organization owners and admins set the retention window in Settings, under Usage log retention, to any value from 1 to 3650 days. A longer window preserves more history for investigation and reporting. A shorter window reduces how much data is stored. A change applies going forward and takes effect on the next daily cleanup.
Retention is why older traffic eventually stops appearing in Request Logs and Usage. To keep request telemetry beyond the retention window, configure an external exporter to deliver usage events to a destination you control before the records are removed.
Next Steps
Continue with Offline Resilience to understand what happens to managed request serving and control-plane signals during temporary connectivity loss.