
Usage Reporting
Use the Usage view to compare request volume, token consumption, and spend across AISIX gateway environments and models. It also summarizes organization-wide semantic-cache savings and helps you investigate unexpected spend or confirm that usage records are reaching the control plane.
How Usage Is Reported
An AISIX gateway serves AI traffic in your runtime environment and reports usage events to the control plane. It derives the telemetry endpoint from the control-plane URL and sends usage data to the fixed /dp/telemetry path. Operators do not configure a separate destination for control-plane usage reporting.
Each event can include request status, latency, token usage, and cost. It also distinguishes the model alias requested by the caller from the resolved model that served an attempt, which helps explain routed and ensemble traffic. Streaming chat requests can report time to first token.
AISIX uses nonzero provider-reported token counts when available. For streaming requests, AISIX also requests usage data from OpenAI-compatible upstreams in the final stream chunk.
The Chat Completions, Completions, Messages, Responses, and Embeddings endpoints may return responses that omit some or all usage data. Examples include an OpenAI-compatible relay that never reports usage, a client that disconnects mid-stream, or an upstream error after a partial response. In those cases, AISIX estimates missing or zero token fields with a local tokenizer. It estimates input tokens from the request sent upstream and output tokens from content delivered to the caller while retaining nonzero provider-reported values.
AISIX emits the usage event with the estimated counts, so the request remains included in telemetry, spend, budgets, and token rate-limit accounting. Locally counted events are marked as estimated, and the Request Logs view shows an estimated badge on those rows. Estimated counts closely match OpenAI-family models and are approximations for models with proprietary tokenizers. Estimation does not apply to other endpoint families.
The estimate counts non-text content in the prompt as follows. These rules apply only when AISIX estimates; a provider-reported count is always used as is.
- Images follow OpenAI's vision token formula wherever they appear in the prompt, including inside tool outputs and tool results. An image with
loworautodetail, or with no detail, counts as 85 tokens. At any other detail, AISIX reads the dimensions from inline base64 image data, fits the image within 2000 pixels on the long side and 768 pixels on the short side, and counts 85 tokens plus 170 for each 512-pixel tile. AISIX never fetches a remote image URL, so a remote image at such a detail counts as 250 tokens, and inline data whose dimensions cannot be read counts as a 300 by 300 pixel image. - An Anthropic-format
imageblock carries no detail and always counts as 85 tokens. For a large image this can be well below what Anthropic meters. - File, PDF, and audio data, encrypted reasoning content, thinking signatures, and similar opaque payloads are not counted. An Anthropic document with a
textorcontentsource counts its text. - A base64
data:URI counts as media only in an image, file, or audio field. In a text field it counts as text, the same way the provider bills it.
Estimated Counts in the Caller's Response
Where AISIX serializes the response body itself, the estimated counters are also written into the usage block the caller reads, so a client and the control plane report the same numbers. That covers buffered /v1/chat/completions responses, including semantic-cache hits, and the bridged /v1/messages and /v1/responses paths. A route that relays the provider's bytes verbatim leaves the body untouched. Streaming /v1/chat/completions is the one exception on this list: the client-visible usage there is what the upstream sent, so it can be absent or zero when the upstream omits it, while the usage record still carries the local estimate.
The fill is per counter: a count the upstream reported stands, a missing or zero count is filled, and total_tokens is recomputed from input plus output when a counter beside it was filled. What is billed does not change. The response carries no marker saying a count was estimated; the usage_estimated field on the usage record, surfaced as the estimated badge in Request Logs, remains the signal.
Counts Are Recorded as Reported
The usage record keeps the token counts as the upstream reported them, and the control plane stores them without checking them against each other. Upstreams differ in whether completion_tokens includes reasoning and whether prompt_tokens includes cached input, so a record can show reasoning_tokens above completion_tokens, or cached_prompt_tokens above prompt_tokens. Such a record is stored and priced like any other. A control plane at 1.4.0 or earlier rejected it, so the request was missing from Request Logs, Usage, and spend.
The record also carries total_tokens, the total the upstream itself reported, stored as received. It is never computed, and it is null when the upstream reported none. Anthropic, for example, never reports one, and neither does a gateway at 1.4.0 or earlier, so older rows have no total either. The total is not necessarily the sum of the other counters, because upstreams differ in which token classes they count. It is also what tells the control plane how to price reasoning tokens; see How Reasoning Tokens Are Billed.
These are the recorded counts, not the ones the caller reads. The usage block in a response is adapted to the protocol the caller used and does not change: an OpenAI-shape response from a Gemini thinking model on Vertex AI still counts the thinking tokens inside completion_tokens. See Recorded Token Counts.
Interpret Usage
The Usage view summarizes AISIX gateway traffic across environments over a rolling 30-day window. All totals and tables use this same window.
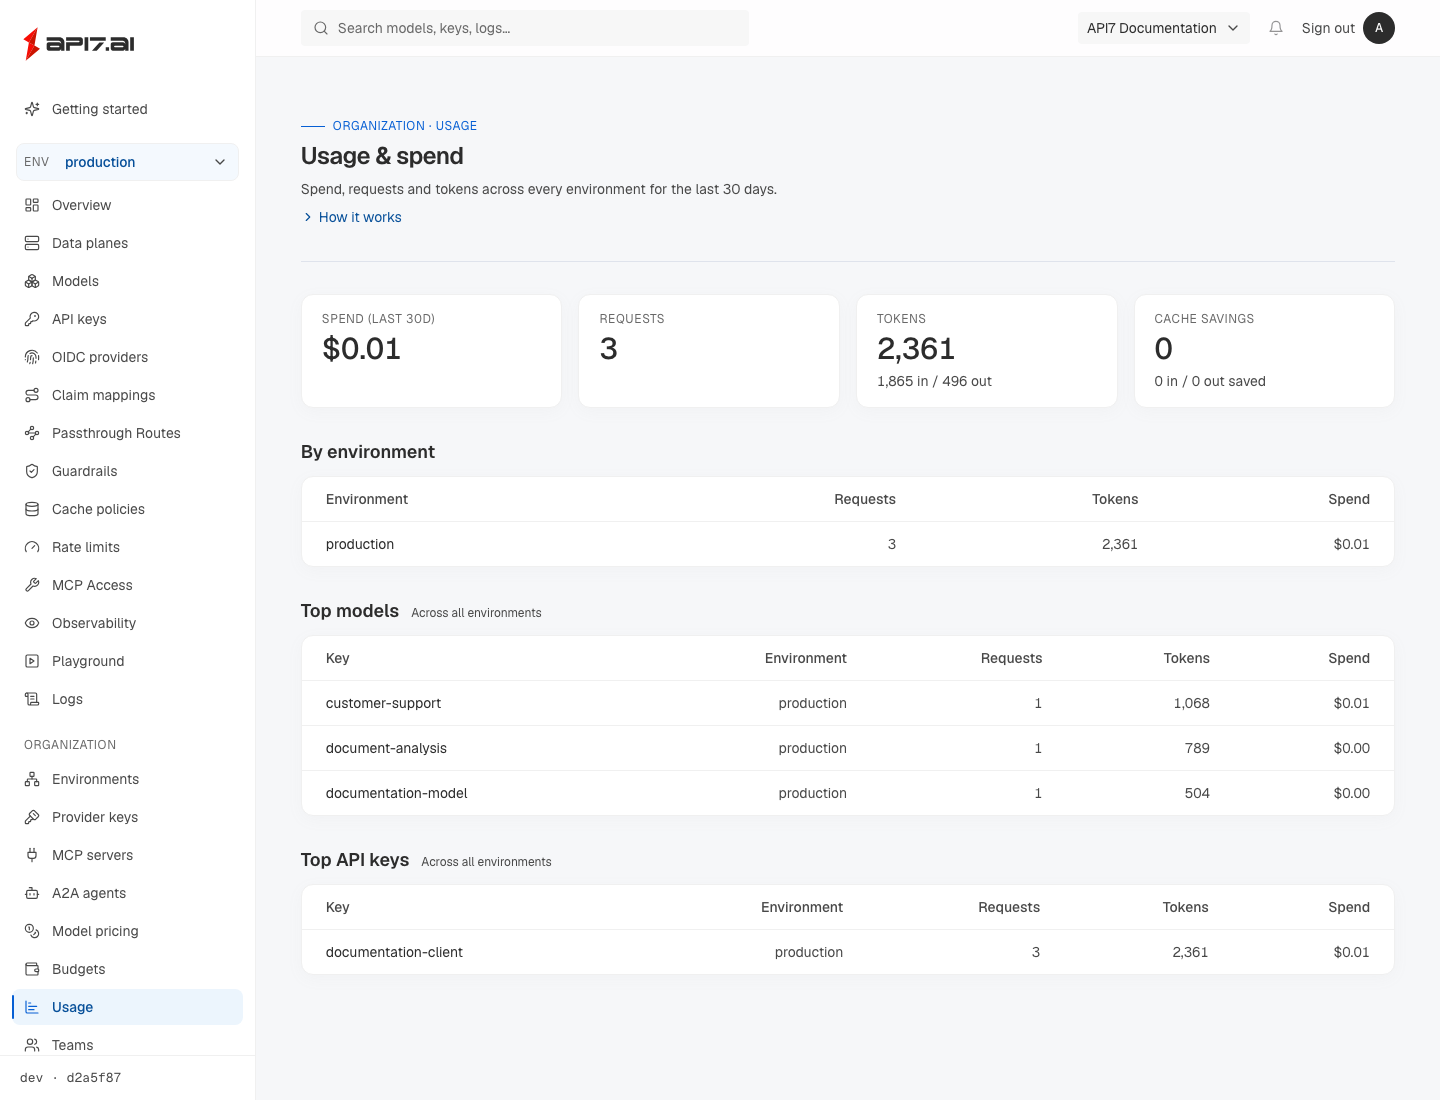
| Signal | What It Helps Explain |
|---|---|
| Request count | Traffic volume and changes in demand. |
| Token totals | Token consumption, adding up each record's own total: the total the upstream reported where there is one, otherwise input + output + cache creation + cache read tokens. The line beneath it still sums input and output separately. |
| Spend | Cost calculated by applying matching model rates to token counts and, for duration-priced transcription or translation requests, measured audio length. |
| Cache savings | Upstream input and output token consumption avoided by semantic-cache hits. |
| Usage by environment | Which deployment environment generated traffic and spend. |
| Top models | Up to 10 environment and caller-requested model alias combinations, ranked by spend. Older records without a requested-model value fall back to the resolved model. |
| Top API keys | Up to 10 environment and caller API key combinations, ranked by spend. |
Where local token estimation is supported, missing or zero token counts are estimated by the gateway. Audio endpoints do not estimate missing token counts; transcription and translation requests can instead contribute duration-based spend. Spend also requires a price that matches the event's (provider, model name) pair and a nonzero rate for the applicable usage basis. Usage rounds spend to two decimal places, so low-volume traffic can show $0.00 even when a matching price exists.
Use Model Pricing to add or inspect a price, and use Request Logs to inspect event or attempt cost at six decimal places. Pricing changes apply only to events recorded after the change.
Usage and Budget Enforcement
The control plane uses AISIX gateway usage records to evaluate budgets. Each budget defines its scope, spending limit, period, and enforcement mode.
The rolling 30-day Usage window is independent of a budget's configured period, so their totals can cover different time ranges.
When a hard-stop budget is exceeded, the AISIX gateway can reject matching requests with HTTP 429. Warn-only budgets surface the over-budget state without blocking traffic.
If a budget rejection is unexpected, check the returned budget scope, the configured limit, and the caller API key bindings that determine which team or member budgets apply. For the complete enforcement path, see Budgets.
Troubleshoot Missing or Unexpected Usage
Check the reporting path in order:
- Confirm that the request used the AISIX gateway attached to the expected environment. Traffic through another environment in the same organization appears under that environment. Traffic in another organization appears in that organization's Usage view.
- Check that the request completed and appears in Request Logs. A newly completed request can take a few seconds to appear because gateways flush telemetry in batches.
- Confirm that the AISIX gateway has a recent heartbeat.
- Confirm that the gateway can reach the control-plane telemetry endpoint.
- If spend is zero or unexpected, check Model Pricing for an exact provider and model-name match, then confirm that the applicable token or Audio per minute rate is nonzero.
If the gateway served a request that never appears in Request Logs, check aisix_usage_events_rejected_total on the gateway. It counts usage events the control plane rejected inside a batch it otherwise accepted, such as one carrying a malformed ID or a status code outside the HTTP range. Those events are dropped, not re-sent, and each such batch logs control plane rejected usage events in an accepted telemetry batch (events dropped). See How Usage Events Reach the Control Plane.
During a temporary control-plane outage, live traffic can continue with the latest projected configuration. The gateway re-sends a telemetry batch that fails during the outage, backing off from 1 second up to 30 seconds between attempts, as long as the control plane's last answer signalled that it de-duplicates batches. A batch is given up on 30 minutes after its oldest event, so an outage longer than that, or one that fills the gateway's in-memory queue, still leaves usage records missing; aisix_usage_event_drops_total counts them. See How Usage Events Reach the Control Plane. Exporter health, heartbeat, and fresh budget decisions also require control-plane connectivity. Budget checks can temporarily reuse a cached decision before applying the configured fail mode; see Availability and Caching.
Next Steps
Continue with Model Pricing when spend is zero or differs from the provider's pricing basis. To investigate individual requests or control-plane resource changes, see Logging and Auditing.