
Logging and Auditing
The AISIX Cloud control plane gives operators two evidence trails: request logs for AISIX gateway traffic and an audit log for control-plane state changes. Together, they help teams understand what happened to a request and who changed the resources that affect traffic.
Use request logs to investigate a specific AISIX gateway request. Use the audit log to investigate configuration, access, and other control-plane changes.
Request Logs
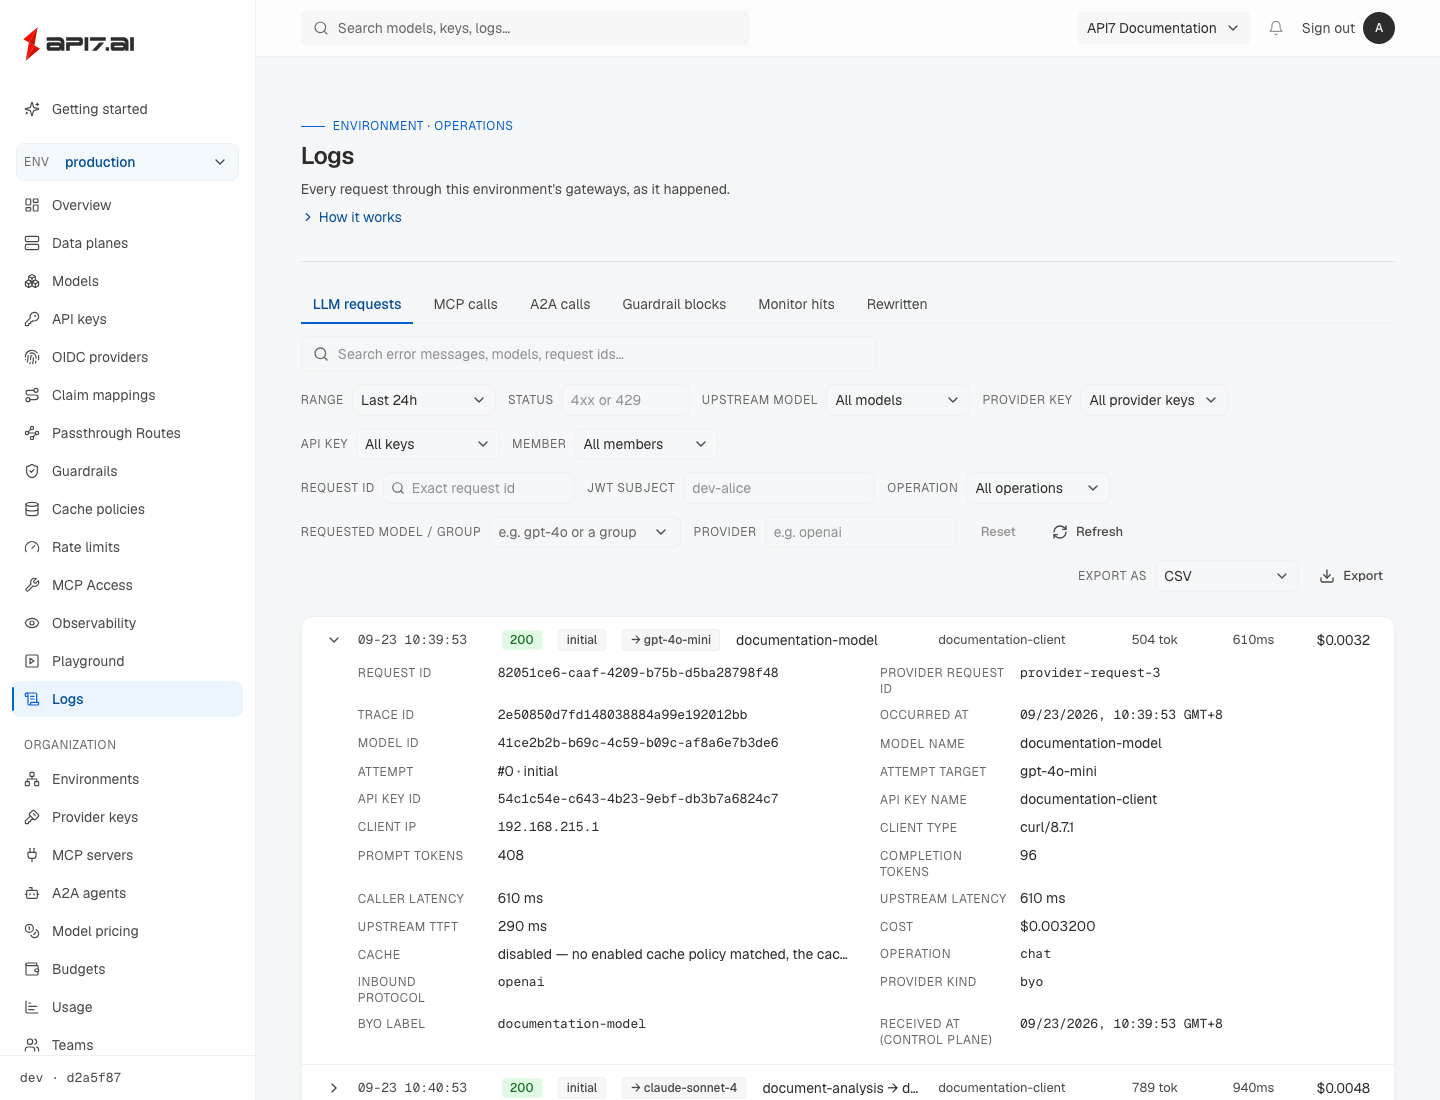
Request logs are built from AISIX gateway telemetry. They show individual request outcomes, including request time, status, requested model, caller API key, latency, token counts, and attempt details when available. Latency is reported from two angles — what the caller waited for and what the upstream spent — so a slow request can be attributed without guesswork.
Expanding a row shows the Request ID AISIX assigned, and — when the call reached a provider that returned one — a Provider request ID beside it. They are different things. The first is the ID AISIX returns to the caller in the x-aisix-request-id response header, and the one a caller reporting a problem will normally have. The second is the ID the upstream provider returned in its own response, such as an OpenAI chat.completion.id or an Anthropic message id, which is what the provider's console and support channel index the call by. Look the request up by the first, read the second from it, and take that to the provider.
The provider request ID is not shown when the call produced none: a response served from cache, a request rejected before AISIX reached the provider, and endpoints whose provider response carries no ID at all, such as embeddings, audio, and image generation. A retried or failed-over request records one per attempt that got a response, so expand the attempt that actually served the caller.
A row's token figure is the total the upstream reported for that attempt when it reported one, and otherwise the sum of its prompt, completion, cache-creation, and cache-read counts. Expanding the row shows the reported total as Total tokens (reported by upstream); a row without one has no such line. The counts are recorded as the upstream reported them, so reasoning tokens can exceed completion tokens on some rows. See Counts Are Recorded as Reported.
Rows with an estimated badge contain one or more token counts calculated locally because the upstream response omitted those values or reported zero. This can occur with OpenAI-compatible relays, client disconnects mid-stream, and upstream errors after a partial response. Estimated counts are included in spend and budget calculations alongside provider-reported counts. The badge distinguishes estimated values when investigating usage or spend. See Usage Reporting for the supported endpoints and estimation behavior.
Freshly completed requests can take a few seconds to appear because data planes flush telemetry in batches.
Each row is timestamped with its local date and time, so a window that spans several days stays readable. Hover over a timestamp to see the full date with its time zone.
Start with request logs when you need to verify a live request, inspect an upstream error, confirm a policy rejection, or check how routing and failover resolved a request.
Read the Latency Figures
A request log row shows what the caller waited for. Expand the row to see the measurement broken out, because a single number cannot answer whether a slow request was the provider's fault or the gateway's:
| Field | Measures | Scope |
|---|---|---|
| Caller latency | Gateway received the request until it completed a non-streaming response or started sending a streamed one. | The whole request, including every retry and failover attempt. |
| Upstream latency | How long the attempt that served the request spent talking to the provider. | One attempt. |
| Upstream TTFT | How long that attempt waited for the provider's first streamed frame, whatever it carries — metadata openers such as response.created or message_start included. Streaming only. | One attempt. |
Caller latency is the figure to quote in an SLO discussion, and it is what the Latency p50 / p99 card on the Overview page reports.
Upstream TTFT stops at the first frame of the stream, not the first visible token. This is the convention proxies and gateways in front of AISIX use, so the figure compares directly with what they log. A reasoning model that streams nothing visible while it thinks — for example, a /v1/responses upstream that opens the stream immediately but emits no reasoning summaries — therefore shows a small TTFT even though the answer text starts much later; that thinking wait is part of upstream latency, not TTFT.
For a streamed response, caller latency deliberately stops when the stream begins rather than when it ends. A stream's total duration grows with however many tokens the model generated, which says little about the experience; the wait before output starts appearing is what a user notices.
Comparing the fields locates the delay. When caller latency far exceeds upstream TTFT on a request that did not retry, the time went to gateway-side work. The usual cause is an output guardrail that masks responses: it must buffer the whole stream before releasing any of it. When the two figures are close, the provider was the slow part. On a request that retried or failed over, the gap also contains the earlier attempts, so check the attempt rows first.
The Latency p50 / p99 card counts successful requests only. A rejected request is usually fast precisely because little happened, and including those would pull the percentiles down and mask real slowness. A streamed response that failed after its 200 headers is recorded with the failure's status and is therefore not a success; see Streams That Fail After the Response Head.
Requests recorded by a data plane older than 0.7 carry a single latency value and no caller-facing figure, so they do not appear in the latency percentiles. The split applies to traffic recorded after the upgrade.
Read Guardrail Hits
Expanding a request shows the guardrails that ran and what each one did. Enforced hits lists what a guardrail in block mode did, and Monitor hits lists what a guardrail in monitor mode would have done:
| Section | Label | action | Meaning |
|---|---|---|---|
| Enforced hits | rewritten | masked | Content was masked and the request continued. |
| Enforced hits | blocked | blocked | The guardrail's policy refused the content. |
| Enforced hits | check unavailable | blocked_unavailable | The guardrail could not evaluate the content, and its failure policy refuses what it cannot check. |
| Enforced hits | blocked: buffer cap | blocked_buffer_exceeded | A held-back streamed response outgrew the output buffer cap and was refused unscanned. The hit names the guardrail whose max_buffer_bytes was reached. |
| Enforced hits | matched, not masked | mask_unsupported | A mask rule matched on a route that cannot rewrite content, such as a passthrough route, so the content was served unmodified. |
| Monitor hits | would block | would_block | The guardrail would have refused the content. |
| Monitor hits | would mask | would_mask | The guardrail would have masked the content. |
| Monitor hits | would match, cannot mask | would_mask_unsupported | A mask rule matched on a route that cannot rewrite content, so enforcing it would not mask anything either. |
Bypass reason shows the raw failure tag when content was served without a guardrail's decision. Besides a guardrail kind's own failure tags, it can be unscannable_body, for content AISIX could not read, or output_buffer_exceeded, for a held-back stream released unscanned under on_buffer_exceeded: fail_open. See Guardrail Behavior.
Tell Policy Blocks from Fail-Closed Blocks
The Guardrail blocks tab lists every request a guardrail refused. Its Block type filter separates two kinds of refusal: Policy, where a guardrail refused the content, and Fail-closed, where no guardrail reached a verdict, for example because its provider was unavailable, and the guardrail was configured to refuse rather than let the request through. The filter defaults to All blocks, and each blocked row carries a Policy or Fail-closed badge. An export started from the tab applies the same filter.
A refusal is classified as fail-closed only on positive evidence: at least one enforced hit has an action that starts with blocked_, such as blocked_unavailable or blocked_buffer_exceeded, and no hit carries the policy verdict blocked. Every other refusal is listed under Policy. That includes refusals whose type cannot be told apart, such as a refusal recorded with no enforced hits or with hits too large to read, and every refusal recorded before the control plane was upgraded to a version with this filter.
See What a Semantic Guardrail Measured
Expanding a request also shows Semantic guardrail scores when an embedding-similarity guardrail screened it. Each entry names the guardrail and the hook that ran, which example list it scored against, the similarity it measured against the threshold it was compared to, the embedding model that produced the score, and the line number of the closest example in that list.
These are recorded on requests the guardrail allowed as well as on ones it refused, and in monitor mode as well as block. That is what makes them useful for tuning: a monitor hit appears only when the guardrail would have blocked, so a row tuned just short of firing — a deny threshold slightly too high, or an allow threshold slightly too low — produces no monitor hit at all and looks identical to a guardrail that is not running. The scores are recorded either way.
A2A and rerank requests can report these scores, but both run only the input hook. A2A resolves no model or MCP server, so only an environment, caller API key, or team attachment reaches it. Every rerank request emits a usage event, at zero tokens when the upstream reports no token count, so a screened rerank request always has a row to carry its scores.
If the expanded request has no scores, check the rest of the row before deciding that the guardrail did not run:
| What to check | Why scores can be absent |
|---|---|
| Gateway and guardrail scope | An older gateway recorded the request, or no semantic guardrail applied. |
| Earlier guardrail hits | The chain stopped when a higher-priority guardrail blocked the request. |
| Attempt details | Retried, failed-over, and ensemble requests keep scores only on the terminal row, which is not always listed last. |
| Endpoint and hook point | An output-only guardrail cannot run on an input-only endpoint. |
| Request content | Under the default text_source: user_messages, an image-only request has no text to embed. |
| Streaming result | The output exceeded max_buffer_bytes and was refused before semantic screening ran. |
| Failure evidence | The embedding call failed before AISIX could calculate a score. |
An embedding failure leaves one of these signals on the same row:
| Configuration | Request outcome | Evidence |
|---|---|---|
| Block mode, fail closed (default) | Refused | Enforced hits shows check unavailable (blocked_unavailable). |
| Monitor mode, fail closed | Served | Monitor hits shows would block. |
| Either mode, fail open | Served without this guardrail's decision; the remaining chain still runs | Bypass reason identifies the failure. |
Check enforced hits, monitor hits, and the bypass reason before treating an empty score section as proof that nothing happened.
Scores from different embedding models are not comparable, which is why the model is shown beside every score. Neither the screened text nor the example text is recorded — the example is identified only by top_example_index, a zero-based index into that direction's list, which the dashboard renders as a line number counting from one. See Calibrate Semantic Screening Guardrails for how to use these values to choose a threshold.
Filter by Request Kind
Rows carry the kind of work the request asked for — a chat completion, an image generation, a video submission, a tool call — and the Operation filter narrows the feed to one of them. Nothing else on a row answers that question: every OpenAI-compatible endpoint reports the same inbound protocol, so a text conversation and an image generation look alike, and a model name is no substitute because one model serves several endpoints and callers address models through aliases and model groups.
Rows are marked with the operation except for the four conversational ones — chat, messages, responses and completions — which are the common case; expand a row to see the value itself. Requests recorded before the gateway was upgraded carry no operation: they are neither marked nor returned by the filter. The filter applies on every tab, since MCP, A2A and passthrough traffic are operations too, and it stays applied when you switch tabs. It narrows within the tab rather than overriding it, so a combination with nothing in it — mcp on the LLM tab, say — returns an empty list rather than the MCP traffic.
The values and what each one covers are listed in Tell Request Kinds Apart, which also describes how the same field reaches an external exporter.
Two things are worth knowing before reading a count. The operation describes the request, so a failed or policy-rejected row carries the same value a successful one would — which is what lets you see which endpoint a rejection came from. And a request that retries or fails over contributes one row per attempt, so counting rows counts attempts rather than requests.
Search Requests
The search box above the filters looks for the text you type anywhere in a request's text fields, ignoring case. It covers the error message and error class, the requested and resolved model names, and the provider and provider key labels. It also covers the client user agent and source IP, the finish reason, the request ID, and the provider request ID — so an ID quoted by a provider's support channel finds its request here. Use it when all you have is part of an error a client reported and you do not know which field carries it.
Search combines with the filters rather than replacing them. For example, a search for rate limit together with the 5xx status filter returns only the server errors whose text mentions a rate limit. The dedicated filters remain the precise way to narrow by a known request ID, model, provider key, or caller API key.
In the Requested model / group filter, typing searches aliases by case-insensitive substring, while choosing a suggested model or group matches the complete alias exactly, including case. Exports preserve whether the active filter in the request list was typed or selected.
Export Requests
Export downloads every request matching the current filters and search, not just the page on screen. Choose CSV for spreadsheet review or JSON for a downstream pipeline; JSON returns the same fields as the control-plane API, wrapped in a data array with a total count.
Both formats carry the request time, request ID and attempt details, and the status and error text. They also carry the operation, the requested and resolved model names, caller API key name, token counts, latency, and cost. Among the token counts, total_tokens is the total the upstream reported: null in JSON and an empty cell in CSV when it reported none. Both the caller-facing and upstream latency figures are included as separate columns. CSV files are UTF-8 with a byte-order mark, so spreadsheet applications read non-ASCII error messages correctly. Guardrail evidence travels with the row as well: guardrail_scores carries the similarity each semantic guardrail measured, as a column in CSV and as an array in JSON. guardrail_blocked is true for every guardrail refusal, and guardrail_blocked_fail_closed is true only for a refusal classified as fail-closed, as described in Tell Policy Blocks from Fail-Closed Blocks. Rows recorded before the control plane was upgraded read false in that column.
Timestamps are written in UTC by default, RFC 3339 with a Z suffix — for example 2026-09-12T04:03:01Z. Exporting from the console instead renders occurred_at and received_at in the browser's own time zone, so the downloaded file shows the same wall-clock time the page does. A caller using the control-plane API chooses with the optional timezone query parameter, an IANA zone name such as Asia/Seoul: every timestamp then carries that zone's numeric offset (2026-09-12T13:03:01+09:00), while timezone=UTC keeps the Z form and an empty, Local, or unrecognized name is rejected with a 400. Both formats behave the same way, and omitting the parameter leaves the file byte-for-byte as it was before, so existing automation is unaffected.
One export returns at most 50,000 requests, newest first. When the filters match more than that, the control plane exports the newest 50,000 and reports the full match count. Narrow the time range or the filters to export the remainder.
Audit Log
The audit log records control-plane state changes for compliance review and operational investigation. It shows who created, updated, or deleted resources such as environments, models, API keys, provider keys, budgets, policies, and admin tokens.
Use the audit log when traffic behavior changes after a configuration update. Request logs can show the request outcome, while the audit log can show whether a control-plane resource changed before that outcome.
Audit log access is restricted to organization owners and admins.
Entries are listed newest first, and the footer below the trail reports how many entries the current filters match in total. Page numbers refer to that whole filtered set rather than to what has been loaded so far, so a review can be resumed at a known position.
Filter and Search the Trail
The filters above the trail narrow it by resource type, actor, and time. The resource-type list offers only the types this organization has actually recorded. The time range offers presets and a Custom range, which takes an explicit start and end time so a review can be pinned to the exact window an incident covers.
The search box looks for the text you type anywhere in an entry's readable fields, ignoring case. It covers the recorded before and after state, which is where a resource's display name lives. It also covers the resource type and identifier, the action, the actor identifier, the client IP address, and the user agent. Use it when a ticket names the resource but not which change touched it.
Search combines with the filters rather than replacing them. For example, a search for a model name together with an actor returns only that person's changes mentioning the model. The dedicated filters remain the precise way to narrow by a known resource type or actor.
Export the Trail
Export downloads every entry matching the current filters and search, not just the page on screen. Choose CSV for spreadsheet review, or JSON for a downstream pipeline or an evidence archive. JSON returns the same fields as the control-plane API, wrapped in a data array with a total count.
Both formats carry the entry time and identifier, the action, the resource type and identifier, the client IP address and user agent, and the complete before and after state. They also carry the actor's email address alongside the actor identifier, so an exported file stays readable for a reviewer who does not have dashboard access. CSV files are UTF-8 with a byte-order mark, so spreadsheet applications read non-ASCII resource names correctly.
The created_at column is rendered in the time zone the browser reports, RFC 3339 with that zone's numeric offset — for example 2026-09-12T13:03:01+09:00 — so the exported trail reads the same wall-clock time the page showed. When the browser names no zone, the column stays UTC with a Z suffix, as it always did.
One export returns at most 50,000 entries, newest first. When the filters match more than that, the control plane exports the newest 50,000 and reports the full match count. Narrow the time range or the filters to export the remainder.
The audit trail and its exports use the authenticated dashboard audit route. That route is not part of the admin-token automation workflow documented in the AISIX Cloud Admin API reference.
Investigate a Request Outcome
Send the request through the AISIX gateway endpoint with a caller API key and model alias that belong to the same environment as the gateway.
After the request completes, check request logs for a matching request time, status, requested model, and caller API key. If the request used routing or failover, inspect the resolved model or attempt details when they are available.
An upstream authentication, quota, or provider-side error can still prove that the AISIX gateway path is working. In this case, the request reached AISIX. AISIX selected the configured model and provider key, then the upstream provider returned an error.
Do not treat a provider error as a resource-projection failure unless the log shows the wrong model, provider key, or environment.
Investigate Policy Rejections
AISIX Cloud policies can reject traffic before AISIX calls the upstream provider. Budget hard stops return a budget-related error, and rate-limit policies return a rate-limit error. Guardrails can reject unsafe content before or after the provider call depending on the guardrail hook.
When a request is rejected, first identify whether the response came from AISIX or from the upstream provider. Then use request logs to check the status and request identity.
For budget rejections, compare the returned budget scope with the Budgets view. For rate-limit rejections, check the caller API key, model, team, or member policy that matches the request. For guardrail rejections, check the guardrail scope and the model or caller identity that triggered it.
If Traffic Does Not Appear in Request Logs
Not every request produces a row. Requests rejected before AISIX could attribute them — an unauthenticated call, a failed authentication, a body that cannot be parsed, a body-size rejection — reach the gateway's metrics, and its access log where one is written at all, but never Request Logs. The health and discovery routes produce no Request Logs row at any outcome; /livez and /readyz write no access-log line either. For the complete list of outcomes and the status and error_class each one carries, see What the Usage Log Records.
If request logs do not show the expected record for a request that should have one, check the request path first. Request logs are scoped to AISIX gateway traffic for the selected environment, so requests sent to another gateway endpoint or another environment appear elsewhere.
If the request path is correct, check that the AISIX gateway has a recent heartbeat and can reach the control-plane telemetry endpoint.
Other control-plane signals can help narrow the cause:
| Signal | What it shows |
|---|---|
| Data planes heartbeat | Whether the AISIX gateway is connected to the control plane and reporting from the expected environment. |
| Usage | Whether the control plane received AISIX Cloud gateway telemetry for aggregate usage and budget workflows. |
| Observability exporter health | Whether the gateway has applied exporter configuration and is reporting delivery status for external telemetry destinations. |
External Exporters
Request logs show the control plane's view of AISIX Cloud gateway telemetry. Observability exporters are configured from the environment's Observability view and send usage events from the AISIX gateway to destinations you control.
Use exporters when you need to send request telemetry to an external tracing, logging, storage, or accounting system. Exporter delivery happens from the AISIX gateway directly to the destination. A request log can exist even when an external destination has a credential, network, or receiver-path issue.
Data Retention
The control plane keeps usage data for a per-organization retention window. This includes the data behind both the Request Logs and Usage views. By default, records are kept for 30 days, and the control plane removes older records each day.
Organization owners and admins set the window in Settings, under Usage log retention, to any value from 1 to 365 days. A longer window preserves more history for investigation and reporting, and a shorter one reduces how much data is stored. A change applies going forward and takes effect on the next daily cleanup. The time range you can pick in Request Logs follows the window.
Retention is why older traffic eventually stops appearing in Request Logs and Usage. Removing those records does not reduce spend that budgets have already counted. For longer history, send usage events to external storage with an observability exporter before the records are removed.
Audit events are kept for 730 days by default, then removed by a daily cleanup. The period is a deployment setting, not an organization setting: an on-premises operator sets it with audit.retention_days, and 0 keeps audit events forever. See On-Premises Configuration. To keep audit records beyond the retention period, export the trail before they are removed.
Next Steps
Use the AISIX Cloud Admin API Reference for supported automation operations. To deliver gateway telemetry to systems you operate, continue with Observability Exporters.