Monitoring for Gateway Instances
As we said in How does Apache APISIX connect to API7 Cloud, gateway instances upload Prometheus metrics to API7 Cloud. API7 Cloud collects and visualizes these metrics.
Users can sign in to the API7 Cloud and enter the Monitoring page to see the running status of their gateway instances.
Query Filter
By default, API7 Cloud shows metrics for all gateway instances among all services and their routes, which is a global view. Use the query filter if you want to see the metrics for a specific instance or a service (even a route).
You can use the instance and service/route filters simultaneously to see the monitoring data for the specific service/route in an instance.
Query Time Range
By default, API7 Cloud shows the metrics for the last five minutes. You can
change the time range by selecting a time window. Values can be 5m,
30m, 60m, 6h and 12h.
Diagrams
API7 Cloud draws several diagrams according to the metrics collected from the gateway instances. You can see Apache APISIX Prometheus Plugin to learn more details.
Single Values
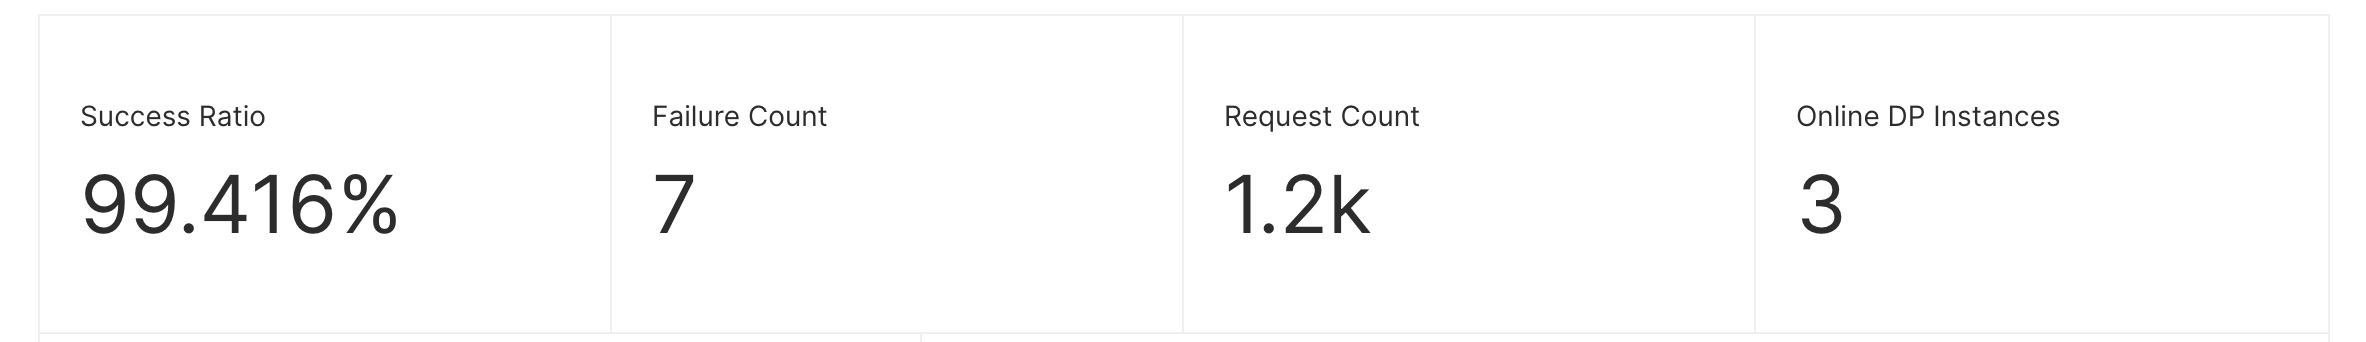
Success Ratio: The ratio of successful requests to total requests.Failure Count: The number of failed requests (during the time range). Requests whose status code is4xxor5xxwill be counted.Request Count: The number of requests (during the time range).Online Gateway Instances: The number of online gateway instances.
Only the gateway instances whose status is Healthy will be treated as online.
Please read How to check Apache APISIX running status to learn more
about Gateway instance status.
The Online Gateway Instance is a global metric so that the query filter won't affect it.
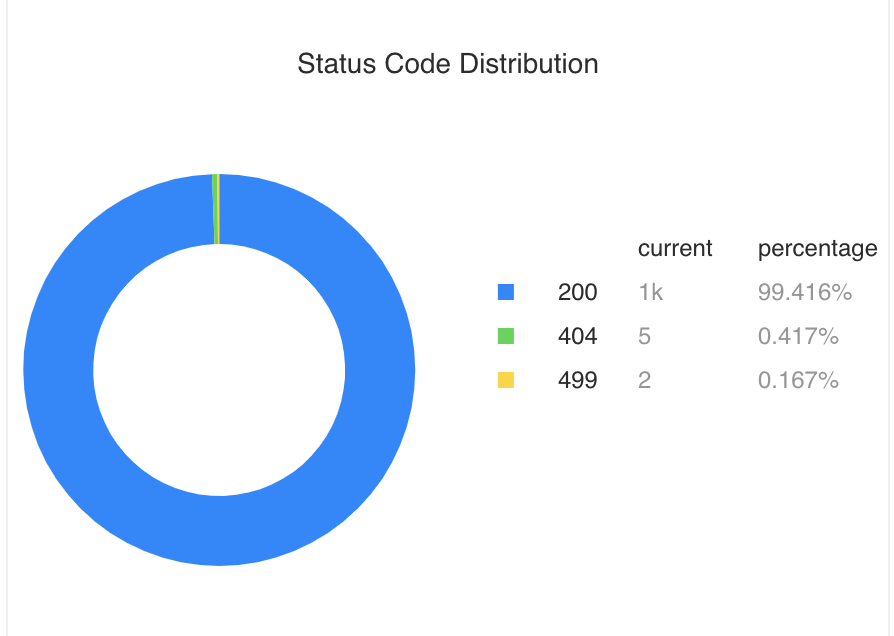
Status Codes Distribution
API7 Cloud also visualizes the status code distribution of the requests (since the time range), it also calculates the proportion for all the status codes.
Bandwidth
API7 Cloud collects and visualizes the bandwidth of the requests (since the time range).
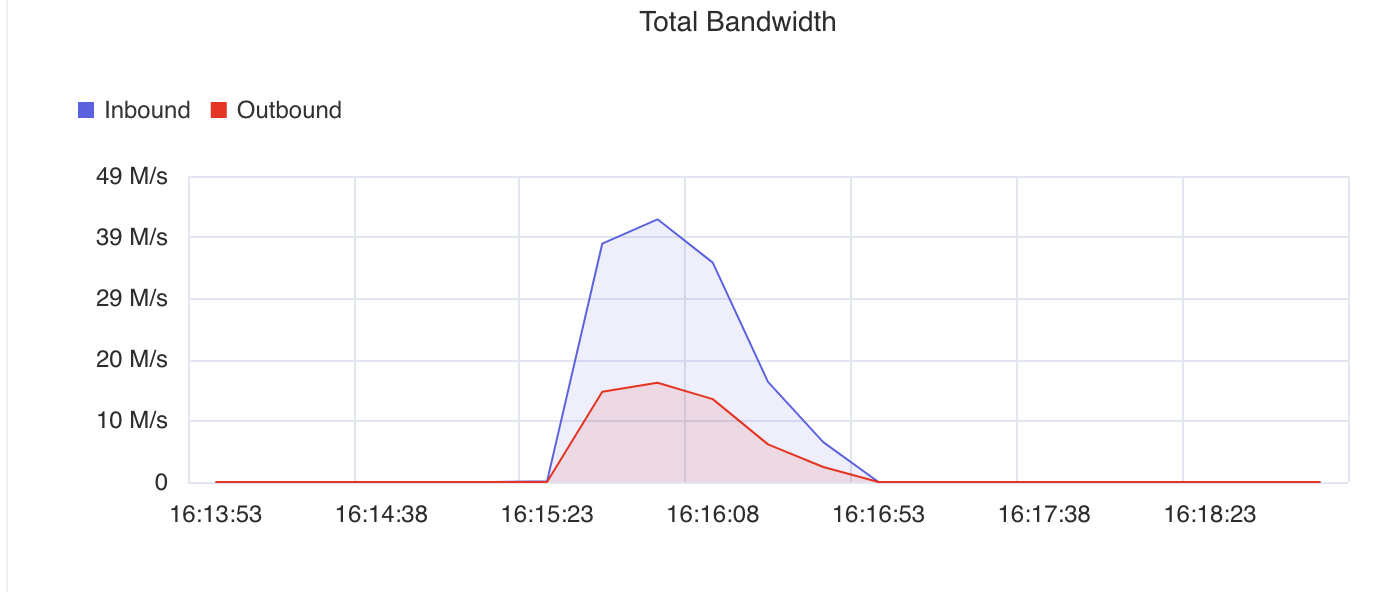
Both the inbound and outbound bandwidth are calculated.
QPS
You can see the QPS of the requests (since the time range).
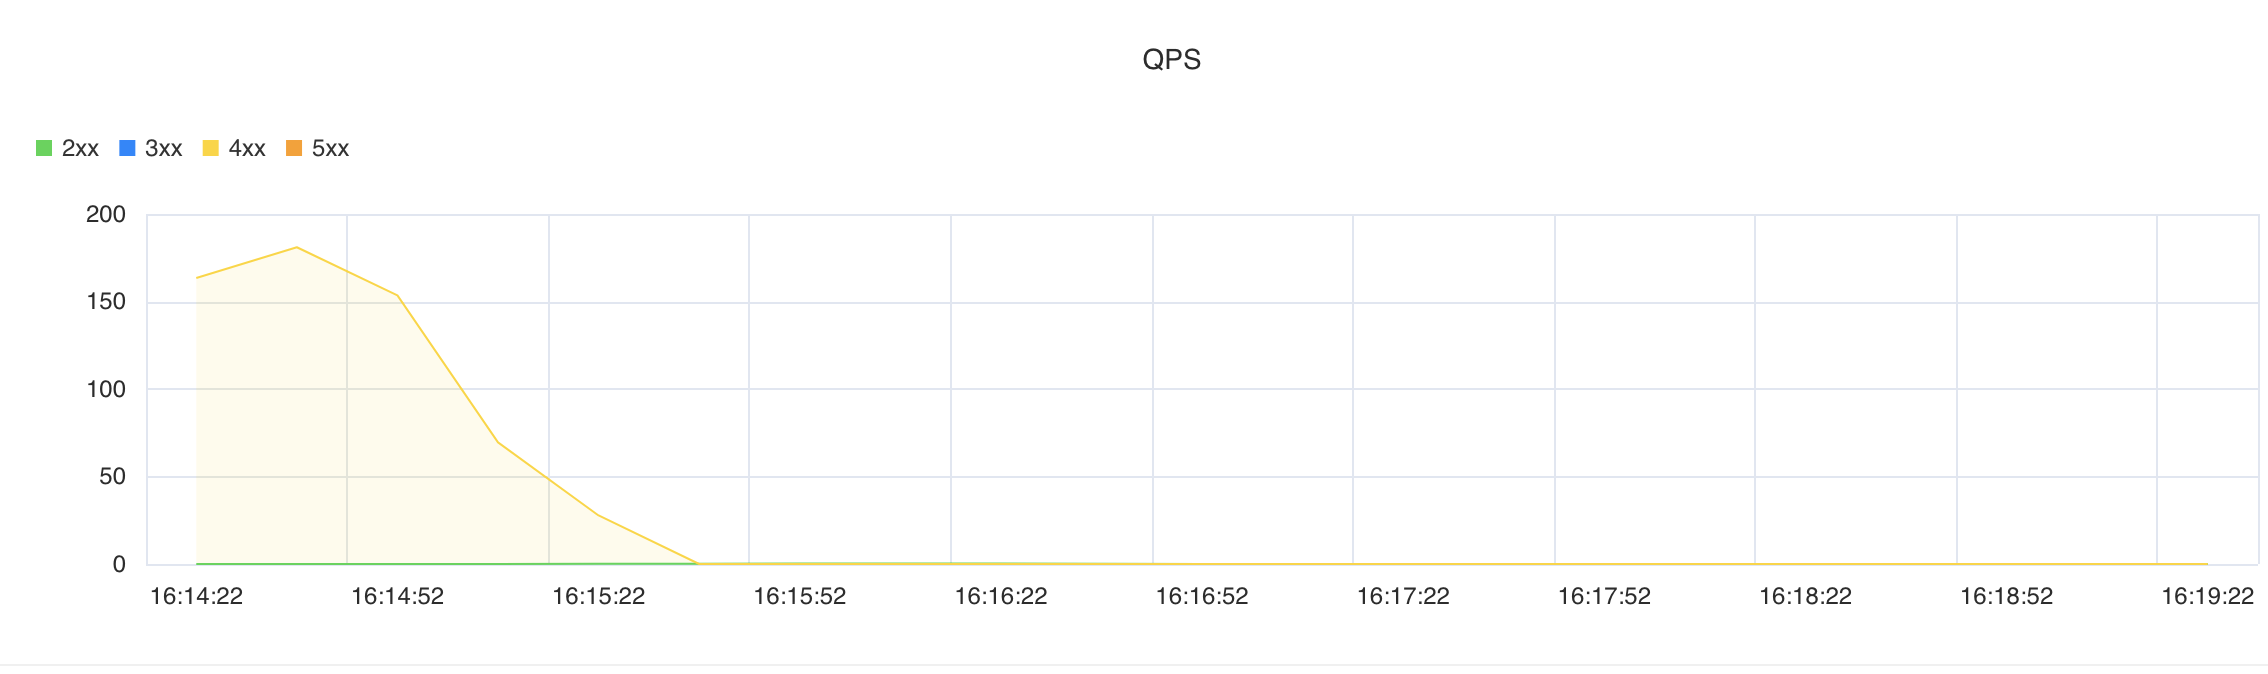
QPS is calculated according the status code range (2xx, 3xx, 4xx, and 5xx)
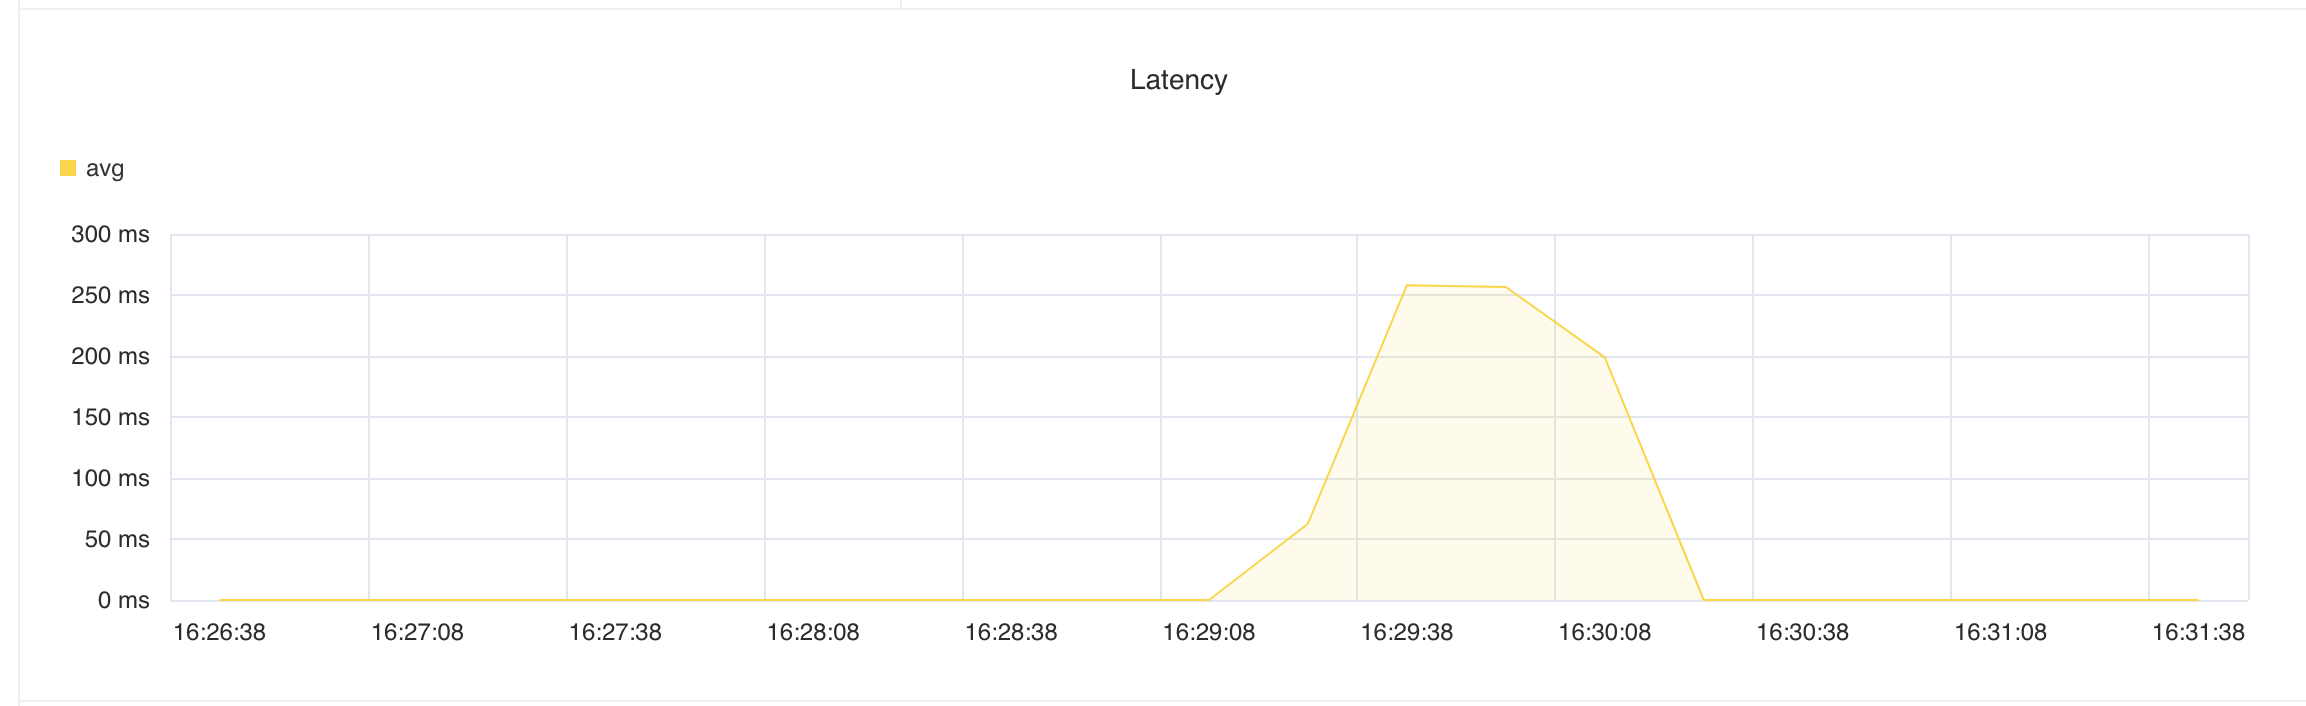
Latency
The Latency diagrams show the mean latency of the requests (since the time range).
Server Connection
The Server Connection diagram shows the number of open connections for the gateway instances
in the time range.
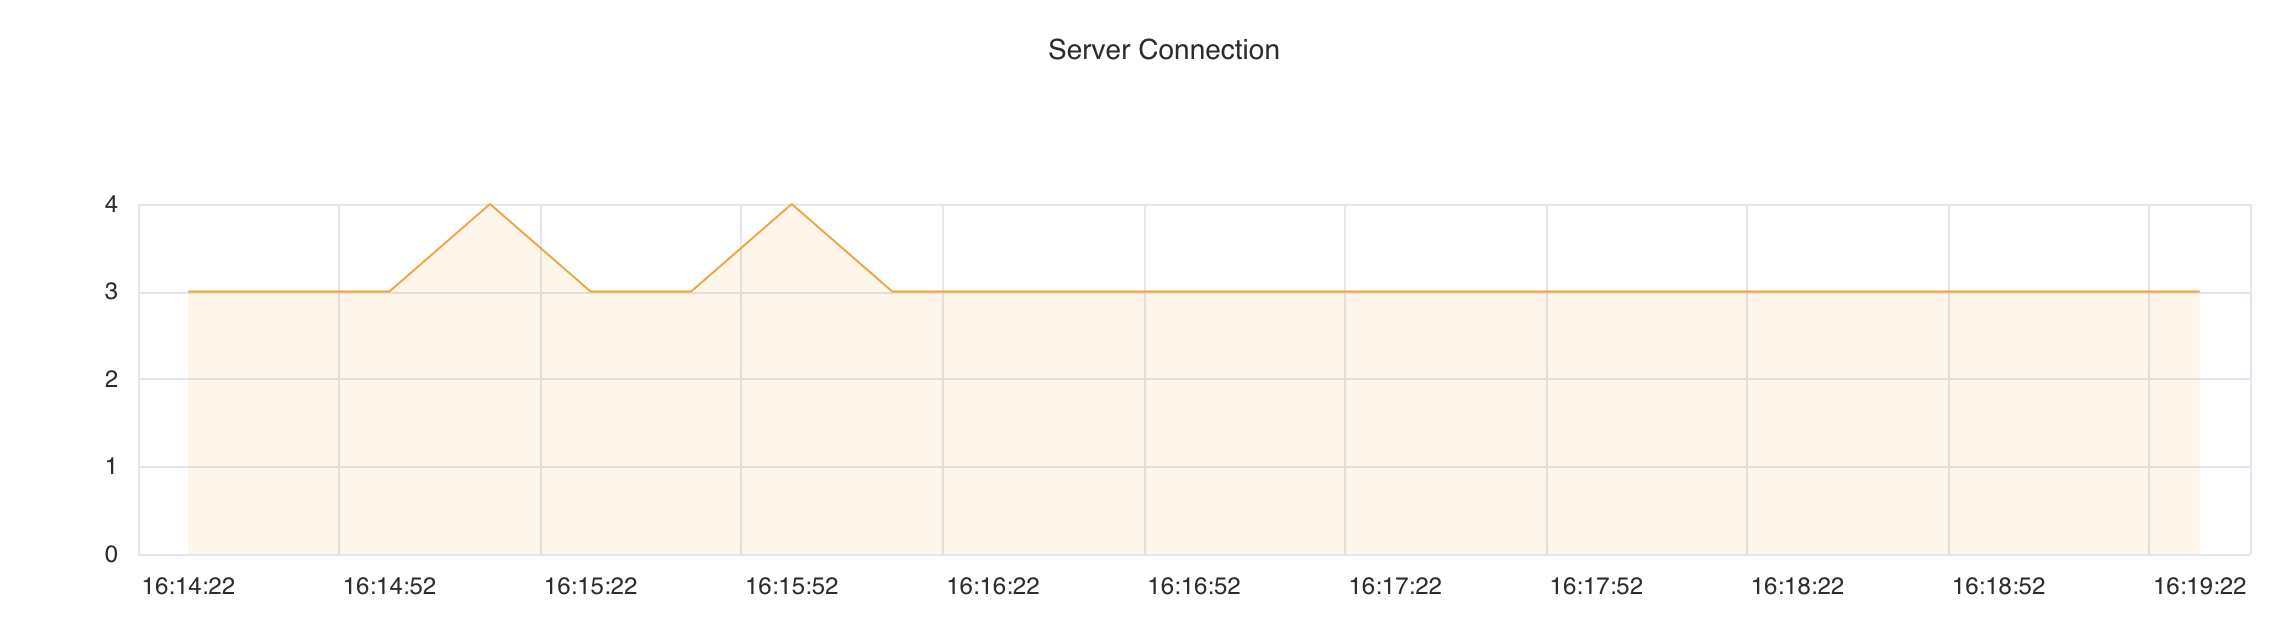
The Server Connection is a global metric so that the query filter won't affect it.