Log with Elasticsearch
Elasticsearch is a popular JSON-based datastore for storing and indexing large volumes of data. It is often used to store logs from various sources and works with tools like Logstash and Kibana to form an entire observability stack known as the Elastic (ELK) Stack.
APISIX supports forwarding its logs directly to Elasticsearch through the elasticsearch-logger plugin. These logs can then be searched, filtered, and visualized through Kibana to gather insights to manage applications.
This guide will show you how to enable the elasticsearch-logger plugin to integrate APISIX with the ELK stack for observability.
Prerequisite(s)
- Install Docker.
- Install cURL to send requests to the services for validation.
- Follow the Getting Started tutorial to start a new APISIX instance in Docker or on Kubernetes.
Start Elasticsearch and Kibana
APISIX currently supports Elasticsearch versions up to and including 7.x. This guide uses version 7.17.1 for both Elasticsearch and Kibana.
Start an Elasticsearch instance in Docker:
docker run -d \
  --name elasticsearch \
  --network apisix-quickstart-net \
  -v elasticsearch_vol:/usr/share/elasticsearch/data/ \
  -p 9200:9200 \
  -p 9300:9300 \
  -e ES_JAVA_OPTS="-Xms512m -Xmx512m" \
  -e discovery.type=single-node \
  -e xpack.security.enabled=false \
  docker.elastic.co/elasticsearch/elasticsearch:7.17.1
Start a Kibana instance in Docker to visualize the indexed data in Elasticsearch:
docker run -d \
  --name kibana \
  --network apisix-quickstart-net \
  -p 5601:5601 \
  -e ELASTICSEARCH_HOSTS="http://elasticsearch:9200" \
  docker.elastic.co/kibana/kibana:7.17.1
If successful, you should see the Kibana web dashboard on localhost:5601.
Enable elasticsearch-logger Plugin
Enable elasticsearch-logger globally and create a sample route to generate logs. Alternatively, you can enable the plugin on a route.
- Admin API
- ADC
Enable the elasticsearch-logger plugin on all routes:
curl "http://127.0.0.1:9180/apisix/admin/global_rules/" -X PUT -d '
{
  "id": "elasticsearch",
  "plugins": {
    "elasticsearch-logger": {
      "endpoint_addrs": ["http://elasticsearch:9200"],
      "field": {
        "index": "gateway",
        "type": "logs"
      },
      "ssl_verify": false,
      "timeout": 60,
      "retry_delay": 1,
      "buffer_duration": 60,
      "max_retry_count": 0,
      "batch_max_size": 5,
      "inactive_timeout": 5
    }
  }
}'
Create a sample route on which you will collect logs:
curl -i "http://127.0.0.1:9180/apisix/admin/routes" -X PUT -d '
{
  "id": "getting-started-ip",
  "uri": "/ip",
  "upstream": {
    "nodes": {
      "httpbin.org:80":1
    },
    "type": "roundrobin"
  }
}'
Enable the elasticsearch-logger plugin globally and create a sample route on which you will collect logs:
global_rules:
  elasticsearch-logger:
    endpoint_addr: "http://elasticsearch:9200"
    field:
      index: "gateway"
      type: "logs"
    ssl_verify: false
    timeout: 60
    retry_delay: 1
    buffer_duration: 60
    max_retry_count: 0
    batch_max_size: 5
    inactive_timeout: 5
services:
  - name: httpbin Service
    routes:
      - uris:
          - /ip
        name: getting-started-ip
    upstream:
      type: roundrobin
      nodes:
        - host: httpbin.org
          port: 80
          weight: 1
Synchronize the configurations to APISIX:
adc sync -f adc-elasticsearch.yaml
Customize Log Format
As an optional step, you can customize the log format for elasticsearch-logger. The log format of most APISIX logging plugins could be customized locally on the plugin (e.g. bound to a route) and/or globally with plugin metadata.
Add host address, timestamp, and client IP address to the logs with built-in variables:
- Admin API
- ADC
curl "http://127.0.0.1:9180/apisix/admin/plugin_metadata/elasticsearch-logger" -X PUT -d '
{
  "log_format":{
    "host":"$host",
    "timestamp":"$time_iso8601",
    "client_ip":"$remote_addr"
  }
}'
plugin_metadata:
  elasticsearch-logger:
    log_format:
        host: $host
        client_ip: $remote_addr
        timestamp: $time_iso8601
Synchronize the configurations to APISIX:
adc sync -f adc-plugin-metadata -f adc-elasticsearch.yaml
Configure Kibana
Send some requests to the route to generate access log entries:
for i in {1..10}; do
  curl -i "http://127.0.0.1:9080/ip"
done
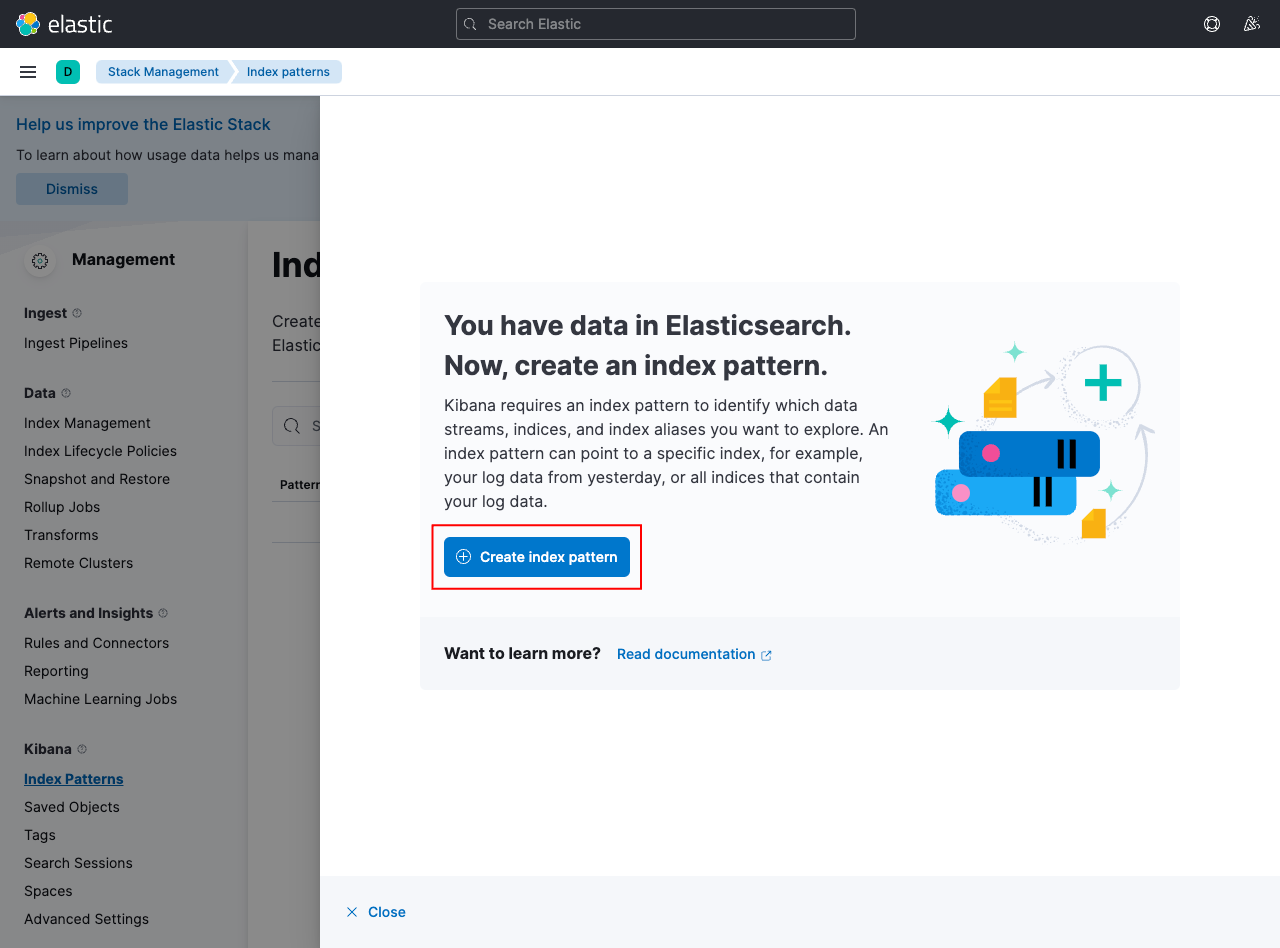
Open Kibana dashboard on localhost:5601 and click the Discover tab from the menu. Create a new index pattern to fetch the data from Elasticsearch:
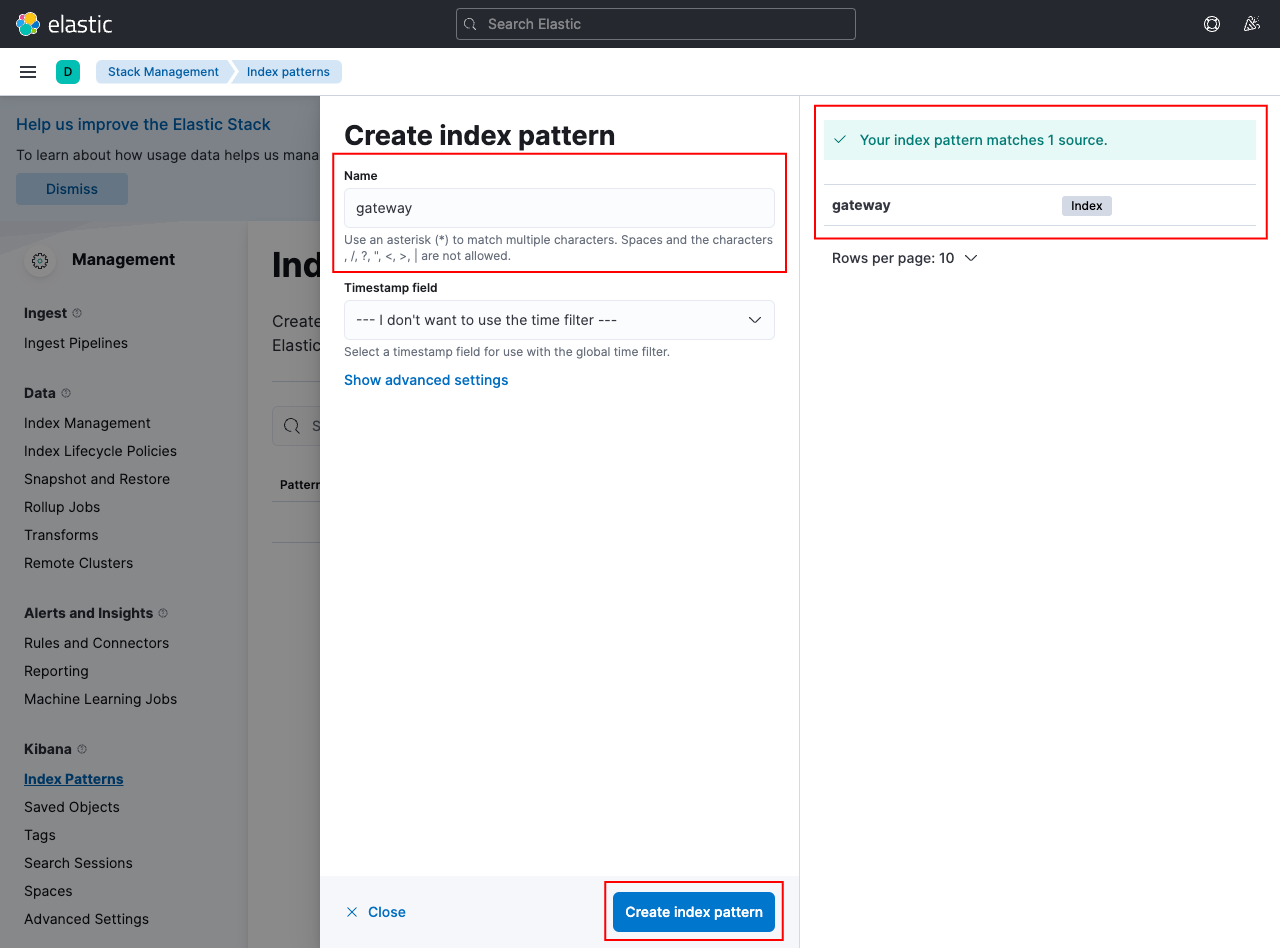
Create a pattern gateway to match the indexed data in Elasticsearch:
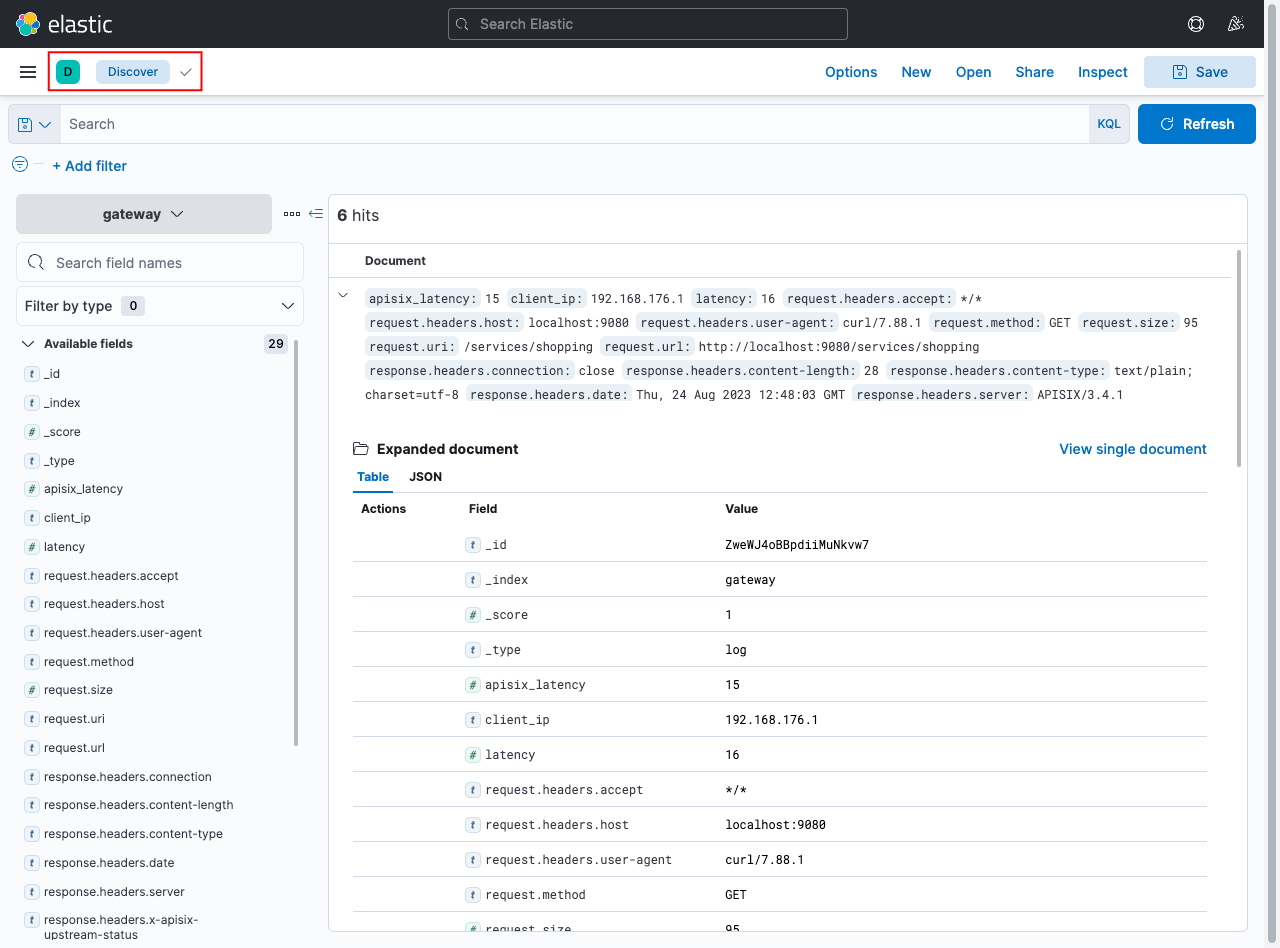
If your configuration is correct, you can go back to the Discover tab and view the logs from APISIX:
Next Steps
See elasticsearch-logger plugin reference to learn more about the plugin configuration options.