Trace Requests with Zipkin
Traces are one of the three pillars of observability, along with metrics and logs. A trace tracks the journey of a request as it traverses through various parts of a system. It is an effective mechanism that helps developers and administrators monitor system performance, identify bottlenecks, and improve user experience.
This guide will walk you through how to trace requests to APISIX using the zipkin plugin and send traces to Zipkin.
Prerequisite(s)
- Install Docker.
- Install cURL to send requests to the services for validation.
- Follow the Getting Started tutorial to start a new APISIX instance in Docker or on Kubernetes.
Start Zipkin Instance
Start a Zipkin instance:
docker run -d --name zipkin -p 9411:9411 openzipkin/zipkin
Configure APISIX
Enable zipkin globally and create a sample route to generate traces. Alternatively, you can enable the plugin on a route.
- Admin API
- ADC
Configure zipkin to be a global plugin:
curl "http://127.0.0.1:9180/apisix/admin/global_rules/zipkin" -X PUT -d '
{
  "plugins": {
    "zipkin": {
      "endpoint": "http://192.168.42.145:9411/api/v2/spans",
      "sample_ratio": 1
    }
  }
}'
❶ Set to the /spans Zipkin endpoint. Update with your IP address.
❷ Configure the sample ratio to 1 to trace every request.
Create a sample route where requests through the route will be traced:
curl "http://127.0.0.1:9180/apisix/admin/routes" -X PUT -d '
{
  "id": "zipkin-tracing-route",
  "uri": "/anything",
  "upstream": {
    "type": "roundrobin",
    "nodes": {
      "httpbin.org": 1
    }
  }
}'
Configure zipkin to be a global plugin and create a sample route where requests through the route will be traced:
global_rules:
  zipkin:
    endpoint: "http://192.168.42.145:9411/api/v2/spans"
    sample_ratio: 1
services:
  - name: httpbin Service
    routes:
      - uris:
          - /anything
        name: zipkin-tracing-route
    upstream:
      type: roundrobin
      nodes:
        - host: httpbin.org
          weight: 1
❶ Set to the /spans Zipkin endpoint.
❷ Configure the sample ratio to 1 to trace every request.
Synchronize the configuration to APISIX:
adc sync -f adc-route.yaml
Trace Requests
Send a request to the route:
curl "http://127.0.0.1:9080/anything"
You should receive an HTTP/1.1 200 OK response similar to the following, with trace information in the headers:
{
  "args": {},
  "data": "",
  "files": {},
  "form": {},
  "headers": {
    "Accept": "*/*",
    "Host": "127.0.0.1",
    "User-Agent": "curl/7.64.1",
    "X-Amzn-Trace-Id": "Root=1-65b1dd40-339dc8832b4b78d36703cbc0",
    "X-B3-Parentspanid": "6ca01ad46bdb0198",
    "X-B3-Sampled": "1",
    "X-B3-Spanid": "f02ab1a9b2d5c3e4",
    "X-B3-Traceid": "ef5b16781c7ad00ea2e3efa6f784031a",
    "X-Forwarded-Host": "127.0.0.1"
  },
  ...
}
Navigate to the Zipkin web UI at http://127.0.0.1:9411/zipkin and click Run Query, you should see a trace corresponding to the request:
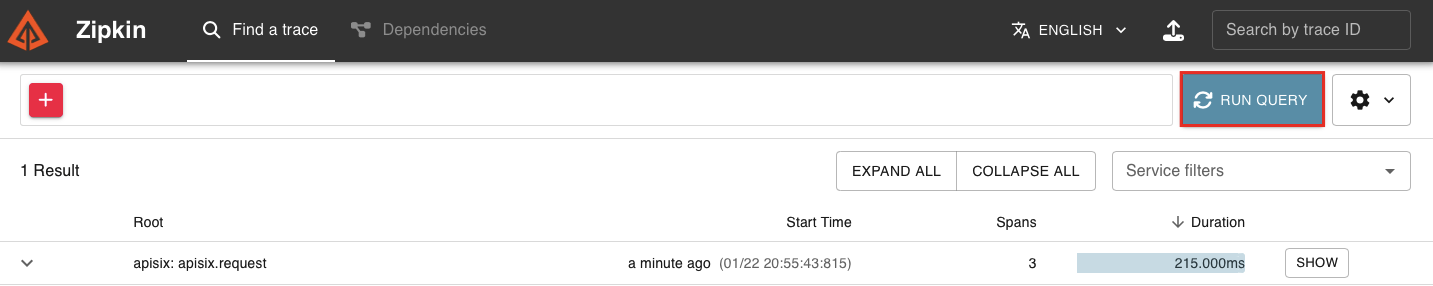
Click Show to see more tracing details:
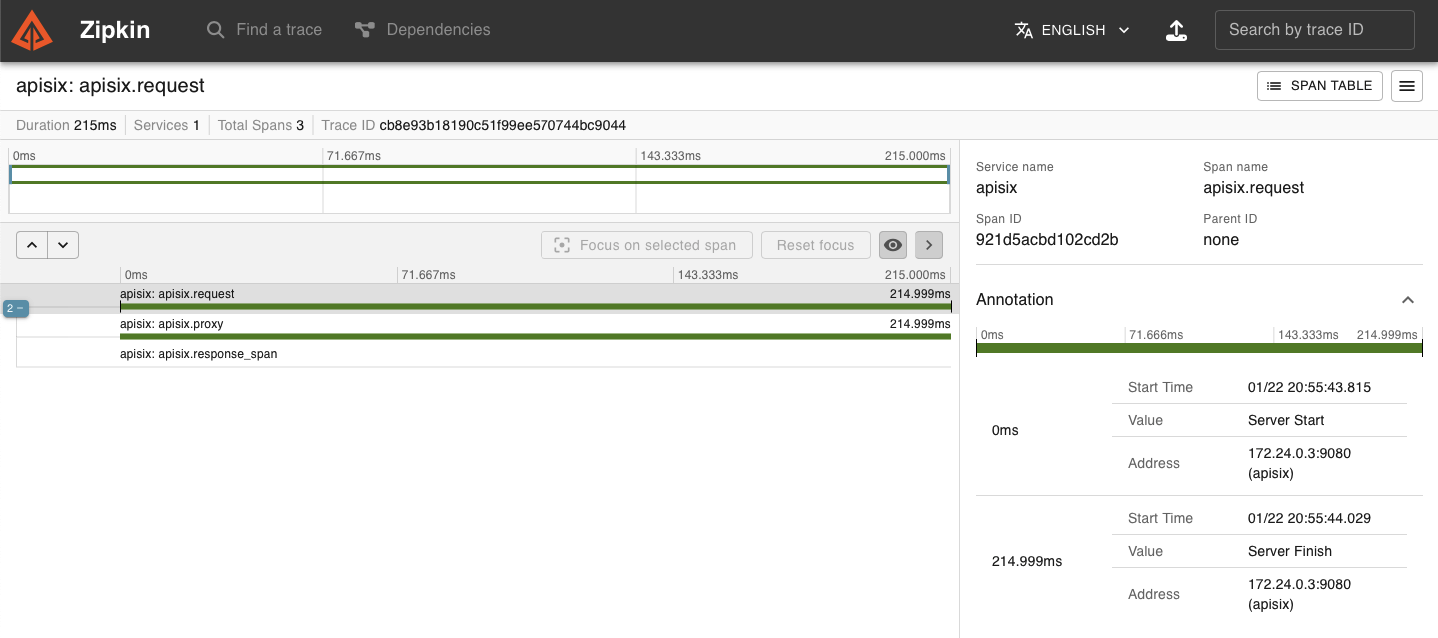
By default, the plugin uses span version 2, where every traced request has proxy and response spans. More specifically:
proxyrepresents the time from the beginning of the request to the beginning ofheader_filterresponserepresents the time from the beginning ofheader_filterto the beginning oflog
To understand the differences between different span versions, see the plugin doc.
Next Steps
You have now integrated Zipkin with APISIX for tracing. In addition to sending traces to Zipkin, the zipkin plugin can also send traces to Jaeger and other compatible collectors. See the zipkin plugin doc for more details.