Monitor APISIX Metrics with Datadog
As the complexity of IT infrastructures and systems increases, continuous monitoring has become a vital part of any IT operation to improve system reliability and avoid costly downtimes.
Datadog is a cloud monitoring platform that offers a unified solution for metrics, logs, and tracing. The platform provides many pre-defined dashboard templates and allows for flexible customization to meet complex data analytics and visualization needs.
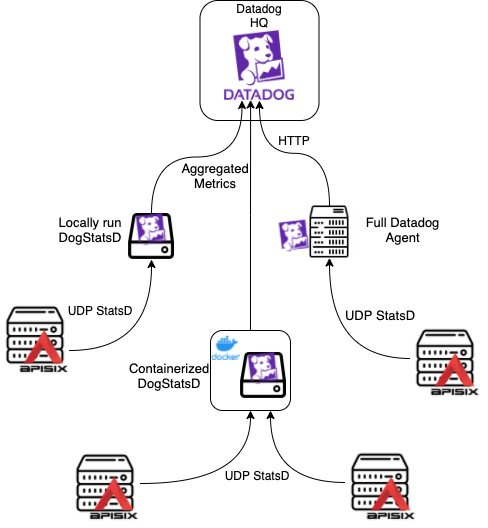
This guide will walk you through the process of integrating Datadog with APISIX using a containerized Datadog agent. You will enable the datadog plugin in APISIX to export metrics to the agent, allowing you to monitor APISIX metrics in Datadog and use them to create additional monitoring, alerting, and analytics.
Prerequisite(s)
- Install Docker.
- Install cURL to send requests to the services for validation.
- Follow the Getting Started tutorial to start a new APISIX instance in Docker or on Kubernetes.
- Create a Datadog account and note down the site and API key.
Start Datadog Agent
The Datadog agent collects events and metrics from monitored objects and sends them to Datadog, where you can further analyze your monitoring and performance data.
Start the Datadog agent:
docker run -d \
  --name dogstatsd-agent \
  -e DD_API_KEY=35ebe12345678dec56218930b79fdb4cf \
  -e DD_SITE="us5.datadoghq.com" \
  -e DD_HOSTNAME=apisix.quickstart \
  -e DD_DOGSTATSD_NON_LOCAL_TRAFFIC=true \
  -p 8125:8125/udp \
  datadog/dogstatsd:latest
❶ DD_API_KEY: replace with your API key.
❷ DD_SITE: replace with your Datadog site.
❸ DD_HOSTNAME: replace with your hostname.
❹ DD_DOGSTATSD_NON_LOCAL_TRAFFIC: set to true to listen to DogStatsD packets from other containers.
You can configure most options in the agent’s main configuration file datadog.yaml through environment variables, prefixed with DD_. For more information, see agent environment variables.
Connect Datadog Agent to APISIX
By default, the datadog plugin expects the Datadog agent to be available at 127.0.0.1:8125. To update the IP address and other metadata, configure the plugin metadata of datadog plugin as such:
- Admin API
- ADC
curl "http://127.0.0.1:9180/apisix/admin/plugin_metadata/datadog" -X PUT -d '
{
  "host": "192.168.0.90",
  "port": 8125,
  "namespace": "apisix"
}'
❶ host: replace with your IP address.
❷ port: replace with your port, if not using the default 8125.
❸ namespace: customize the namespace that prefixes all metrics.
plugin_metadata:
  datadog:
    host: 192.168.0.90
    port: 8125
    namespace: ingress-apisix
❶ host: replace with your IP address.
❷ port: replace with your port, if not using the default 8125.
❸ namespace: customize the namespace that prefixes all metrics.
Synchronize the configuration to APISIX:
adc sync -f adc-plugin-metadata.yaml
Monitor Route Metrics
Enable datadog globally and create a sample route to generate metrics. Alternatively, you can enable the plugin on a route.
- Admin API
- ADC
Configure datadog to be a global plugin:
curl "http://127.0.0.1:9180/apisix/admin/global_rules/datadog" -X PUT -d '
{
  "plugins": {
    "datadog": {}
  }
}'
Create a sample route on which you will collect metrics:
curl "http://127.0.0.1:9180/apisix/admin/routes" -X PUT -d '
{
  "id": "dd-route",
  "uri": "/anything",
  "upstream": {
    "type": "roundrobin",
    "nodes": {
      "httpbin.org": 1
    }
  }
}'
Configure datadog to be a global plugin and create a sample route on which you will collect metrics:
global_rules:
  datadog: {}
services:
  - name: httpbin Service
    routes:
      - uris:
          - /anything
        name: dd-route
    upstream:
      type: roundrobin
      nodes:
        - host: httpbin.org
          port: 80
          weight: 1
Synchronize the configurations to APISIX:
adc sync -f adc-route.yaml -f adc-plugin-metadata.yaml
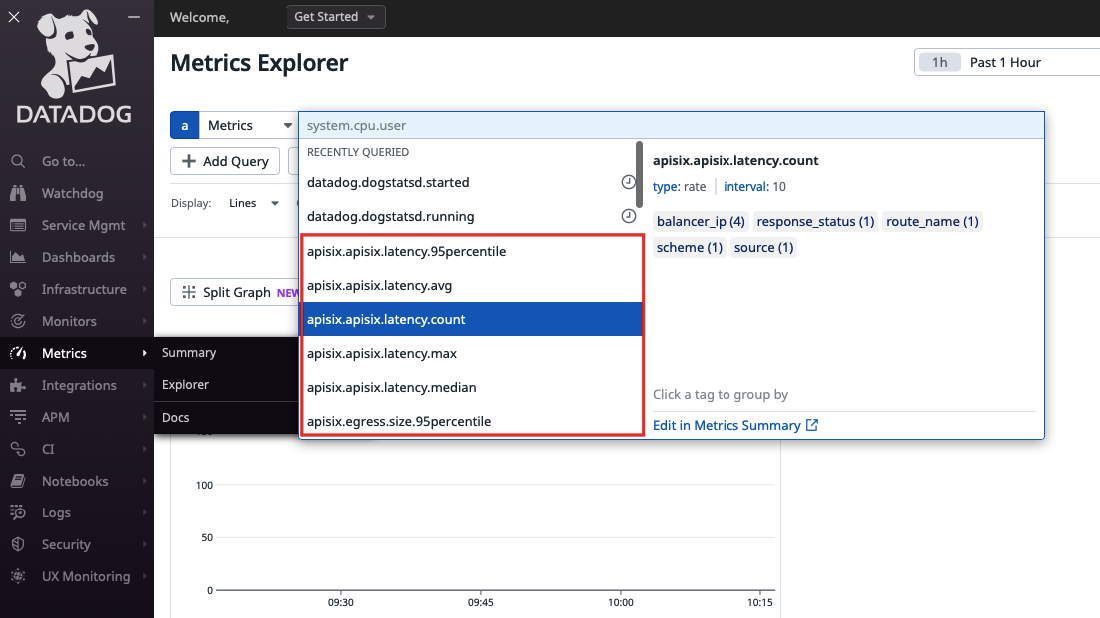
In Datadog, select Metrics from the left menu and go to Explorer. You should see a number of APISIX metrics available:
Generate a few requests to the route:
curl "http://127.0.0.1:9080/anything"
You should receive HTTP/1.1 200 OK responses.
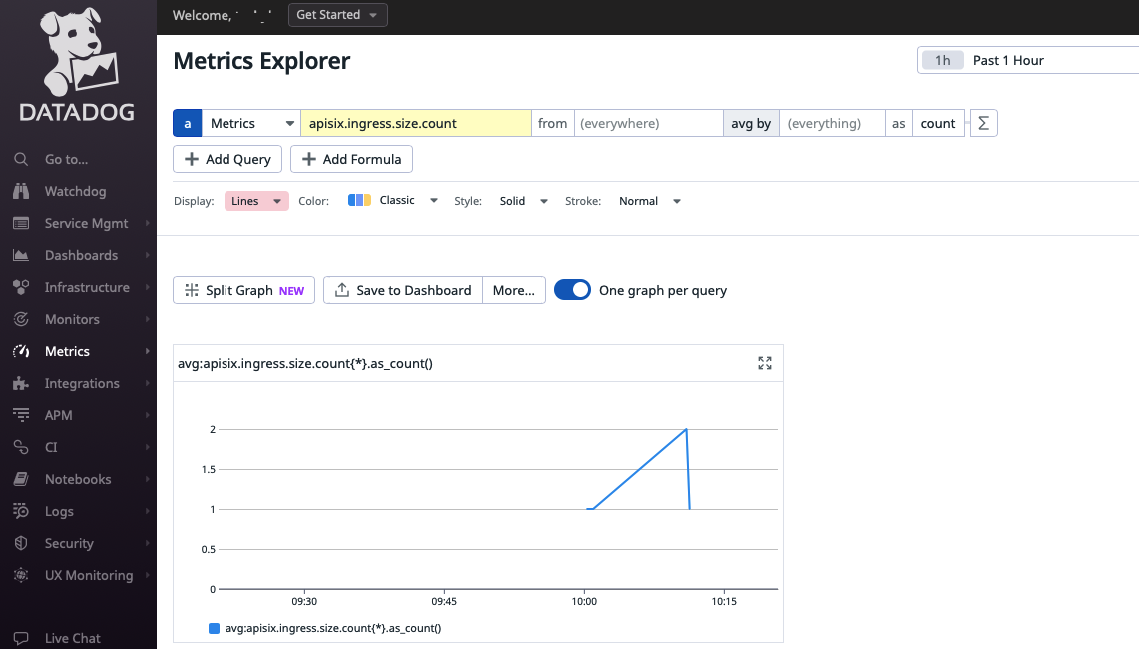
Navigate back to Datadog metric explorer and select apisix.ingress.size.count as the metric. You should see the count reflecting the number of requests generated:
Next Steps
You have now integrated Datadog with APISIX for metrics monitoring. With these metrics, you can now create alerts and dashboards according to your system reliability requirements. For more information, see Datadog documentation.