Monitor APISIX Metrics with Prometheus
Prometheus is a popular systems monitoring and alerting toolkit. It collects and stores multi-dimensional time series data like metrics with key-value paired labels.
APISIX offers the capability to expose a significant number of metrics to Prometheus with low latency, allowing for continuous monitoring and diagnostics.
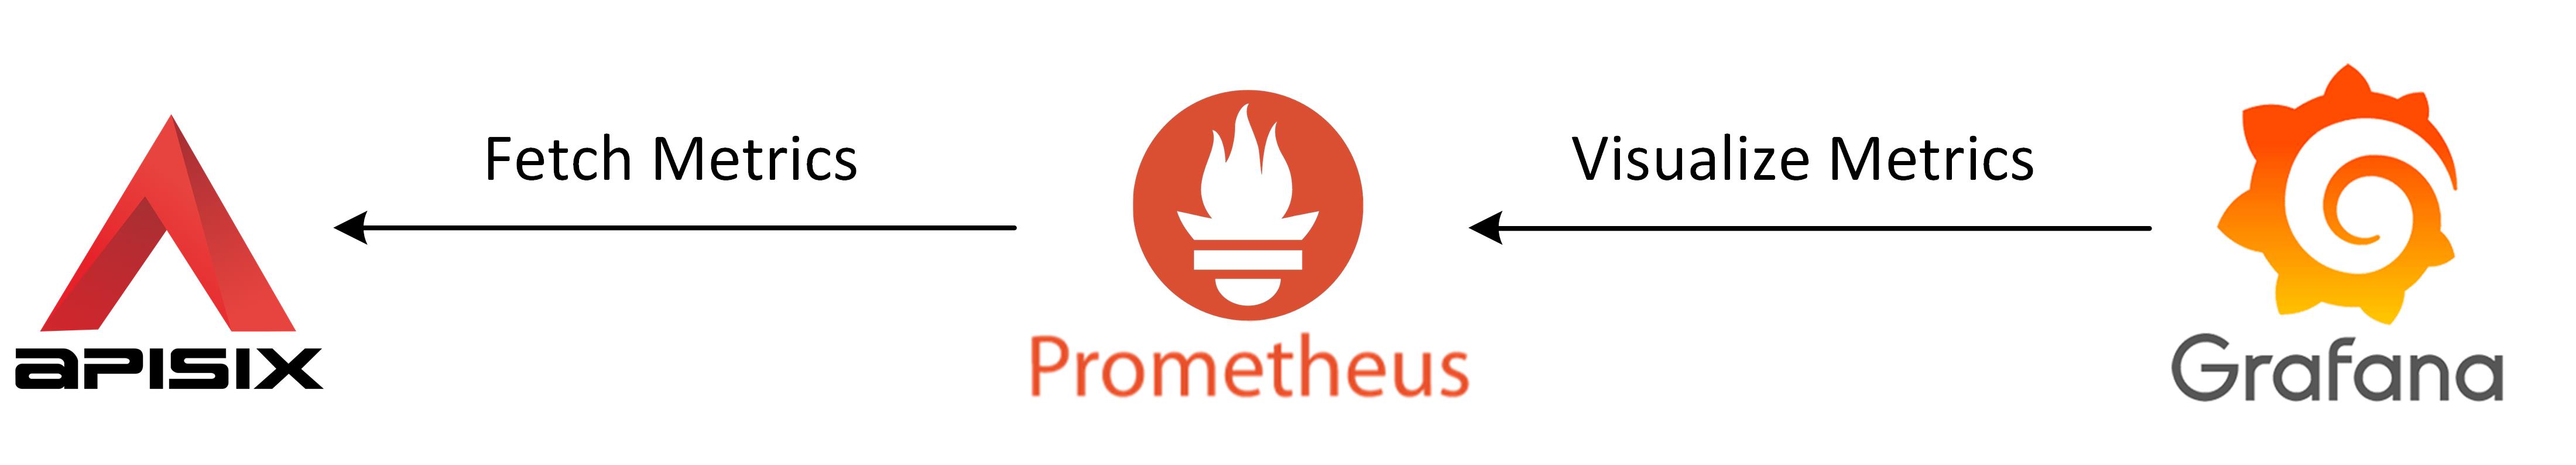
This guide will show you how to enable the prometheus plugin to integrate with Prometheus and Grafana services, where APISIX HTTP metrics are collected and visualized.
Prerequisite(s)
- Install Docker.
- Install cURL to send requests to the services for validation.
- Follow the Getting Started tutorial to start a new APISIX instance in Docker.
Enable Prometheus Plugin
Enable the prometheus plugin globally. Alternatively, you can enable the plugin on a route.
- Admin API
- ADC
curl "http://127.0.0.1:9180/apisix/admin/global_rules/prometheus" -X PUT \
  -H "Content-Type: application/json" \
  -d '{
    "plugins": {
      "prometheus": {}
    }
  }'
APISIX gathers internal runtime metrics and exposes them through port 9091 and path /apisix/prometheus/metrics by default. The port and the path can be customized in the configuration file.
global_rules:
  prometheus: {}
Synchronize the configuration to APISIX:
adc sync -f adc.yaml
APISIX gathers internal runtime metrics and exposes them through port 9091 and path /apisix/prometheus/metrics by default. The port and the path can be customized in the configuration file.
Send a request to the route /apisix/prometheus/metrics to fetch metrics from APISIX:
curl "http://127.0.0.1:9091/apisix/prometheus/metrics"
You should see a list of metrics similar to the following:
# HELP apisix_etcd_modify_indexes Etcd modify index for APISIX keys
# TYPE apisix_etcd_modify_indexes gauge
apisix_etcd_modify_indexes{key="consumers"} 0
apisix_etcd_modify_indexes{key="global_rules"} 0
apisix_etcd_modify_indexes{key="max_modify_index"} 16
apisix_etcd_modify_indexes{key="prev_index"} 15
apisix_etcd_modify_indexes{key="protos"} 0
apisix_etcd_modify_indexes{key="routes"} 16
apisix_etcd_modify_indexes{key="services"} 0
apisix_etcd_modify_indexes{key="ssls"} 0
apisix_etcd_modify_indexes{key="stream_routes"} 0
apisix_etcd_modify_indexes{key="upstreams"} 0
apisix_etcd_modify_indexes{key="x_etcd_index"} 16
# HELP apisix_etcd_reachable Config server etcd reachable from APISIX, 0 is unreachable
# TYPE apisix_etcd_reachable gauge
apisix_etcd_reachable 1
...
# HELP apisix_http_status HTTP status codes per service in APISIX
# TYPE apisix_http_status counter
...
Configure Prometheus
In Prometheus, targets are the endpoints that Prometheus scrapes for metrics. You can configure the APISIX metrics endpoint as a target in Prometheus to collect metrics from it.
Create a configuration file prometheus.yml:
cat > prometheus.yml <<'EOF'
global:
  scrape_interval: 15s

scrape_configs:
  - job_name: apisix
    metrics_path: /apisix/prometheus/metrics
    static_configs:
      - targets:
          - apisix-quickstart:9091
EOF
Create a data volume and start Prometheus. Port 9092 on the host maps to the Prometheus web interface on port 9090 in the container:
docker volume create apisix-quickstart-prometheus-data

docker run -d --name apisix-quickstart-prometheus \
  --network apisix-quickstart-net \
  -p 9092:9090 \
  -v "$(pwd)/prometheus.yml:/etc/prometheus/prometheus.yml:ro" \
  -v apisix-quickstart-prometheus-data:/prometheus \
  prom/prometheus:v3.7.3
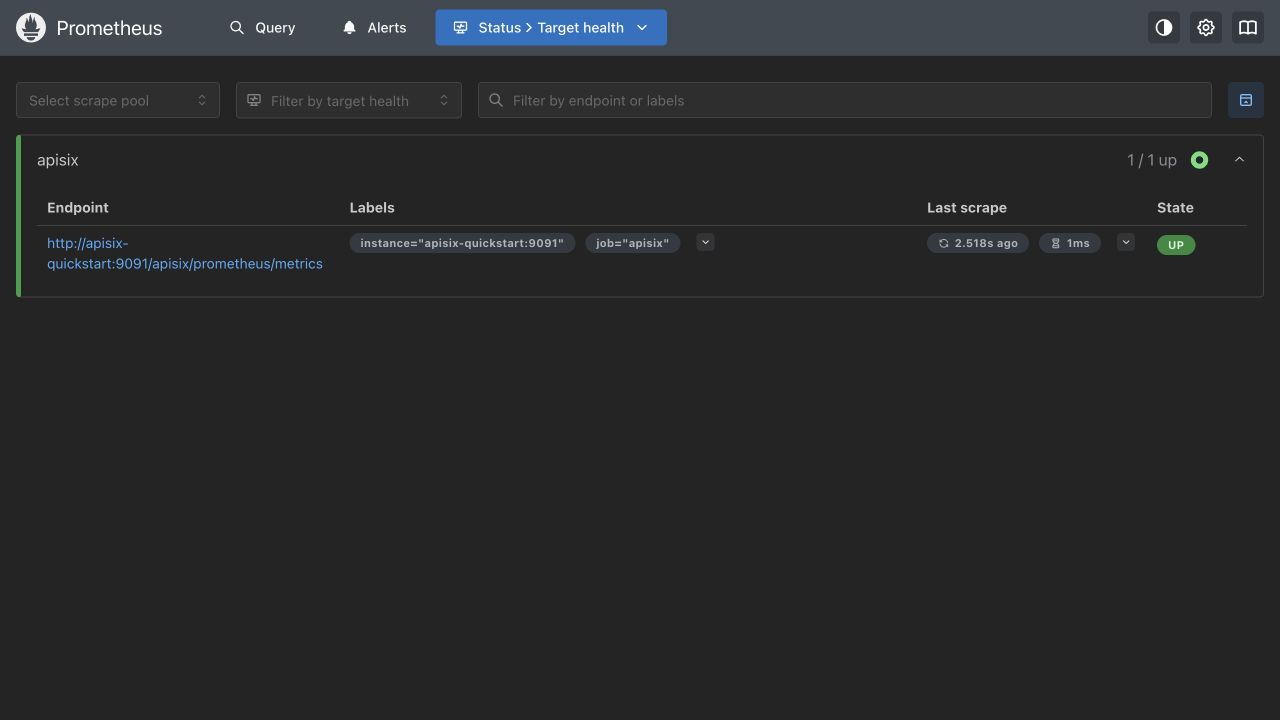
Open the Prometheus targets page. The apisix target should have the UP state.
Configure Grafana
Grafana can visualize metrics stored in Prometheus.
Create a data volume and start Grafana on the same Docker network:
docker volume create apisix-quickstart-grafana-data

docker run -d --name apisix-quickstart-grafana \
  --network apisix-quickstart-net \
  -p 3000:3000 \
  -v apisix-quickstart-grafana-data:/var/lib/grafana \
  grafana/grafana:13.1.0
Open Grafana, sign in with the default username and password admin, and change the password when prompted.
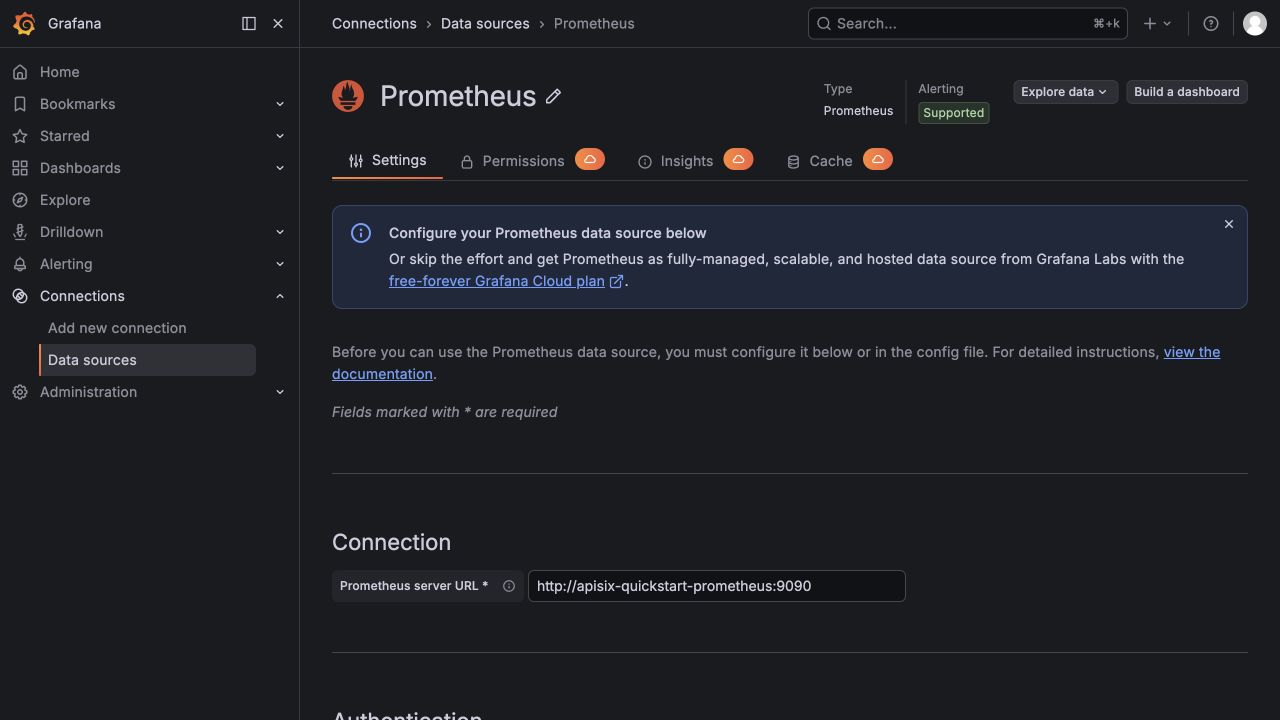
Go to Connections > Data sources, add a Prometheus data source, and set its URL to http://apisix-quickstart-prometheus:9090. This URL uses the Prometheus container name and container port because Grafana makes the request from inside the Docker network. Select Save & test and verify that Grafana can query Prometheus.
Generate gateway traffic and wait for Prometheus to complete a scrape:
for i in {1..100}; do
  curl -sS "http://127.0.0.1:9080/ip" > /dev/null
done

sleep 15
Download the dashboard maintained in the Apache APISIX source tree for this version:
curl -fL "https://raw.githubusercontent.com/apache/apisix/3.17.0/docs/assets/other/json/apisix-grafana-dashboard.json" \
  -o apisix-grafana-dashboard.json
The Grafana catalog page for dashboard 11719 lists compatibility with APISIX 2.10.x and depends on legacy Grafana panels. Use the versioned dashboard JSON above for the metrics exposed in this guide.
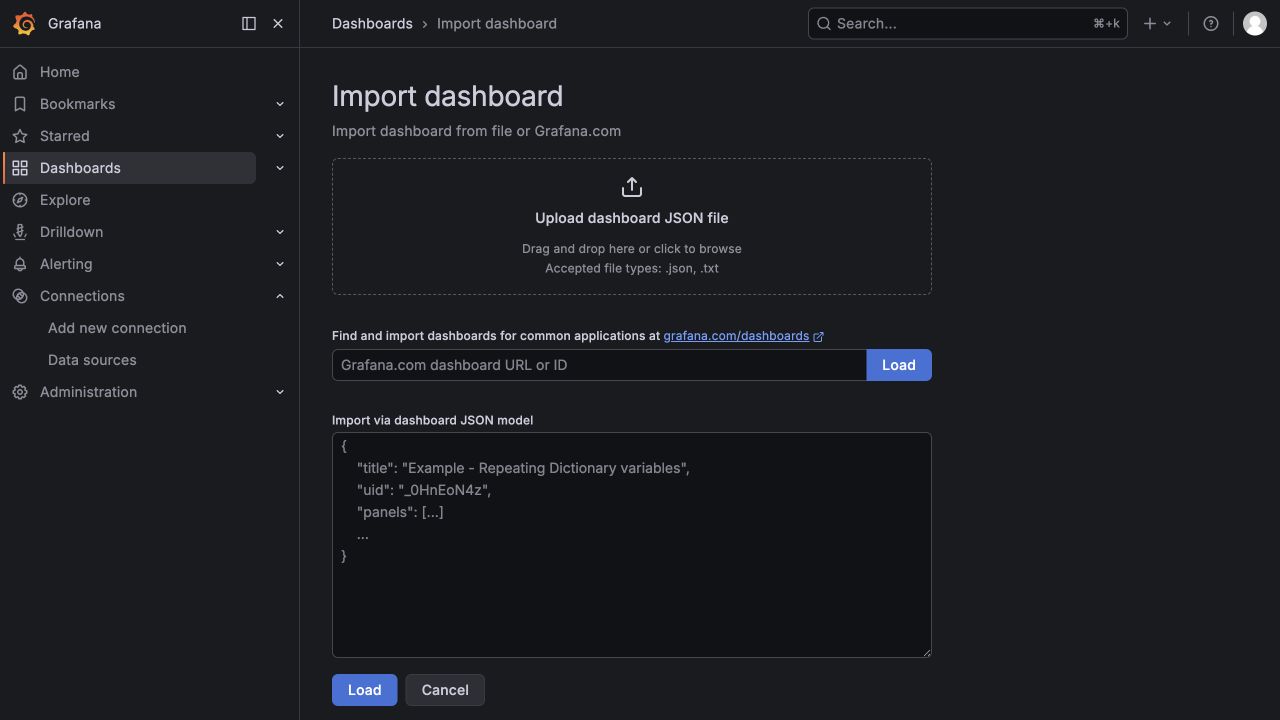
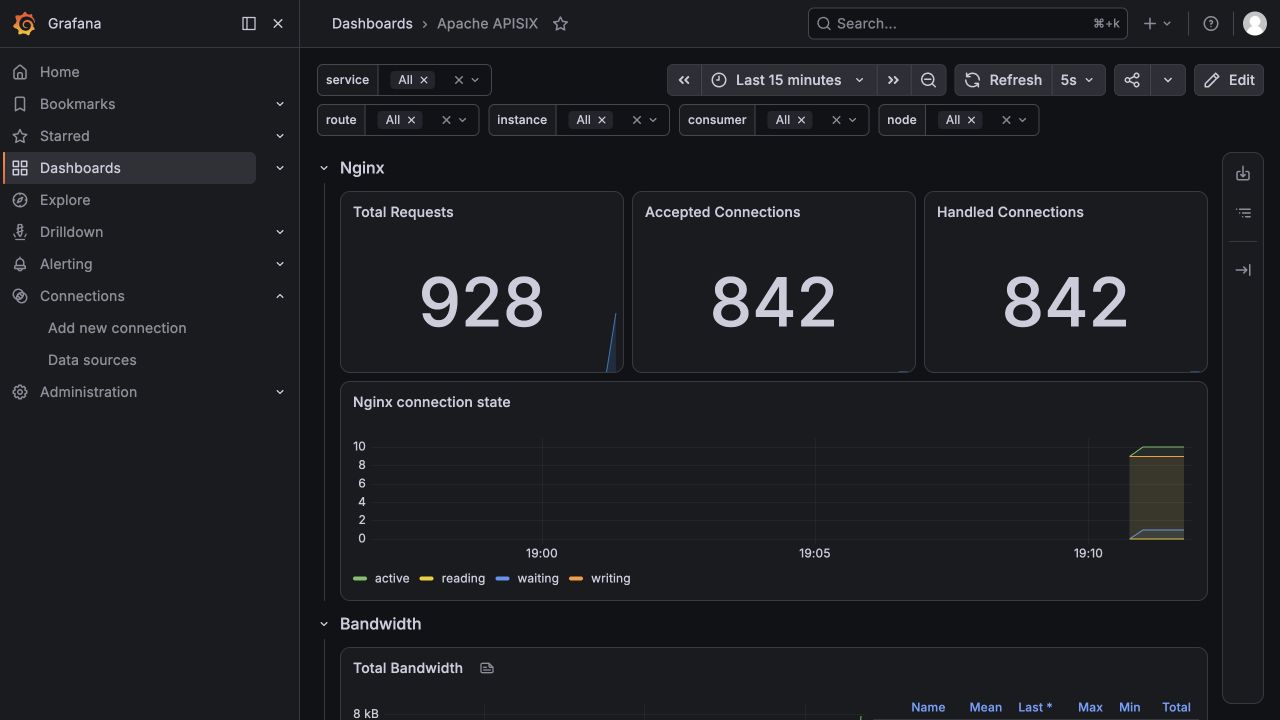
In Grafana, go to Dashboards > New > Import, upload apisix-grafana-dashboard.json, select the Prometheus data source, and select Import.
The dashboard should populate with the requests generated above and show APISIX connection, request, latency, bandwidth, etcd, and shared dictionary metrics.
Next Steps
You have now learned how to monitor APISIX metrics with Prometheus and visualize them in Grafana. See the prometheus plugin documentation for more configuration options.